Fig. 3.
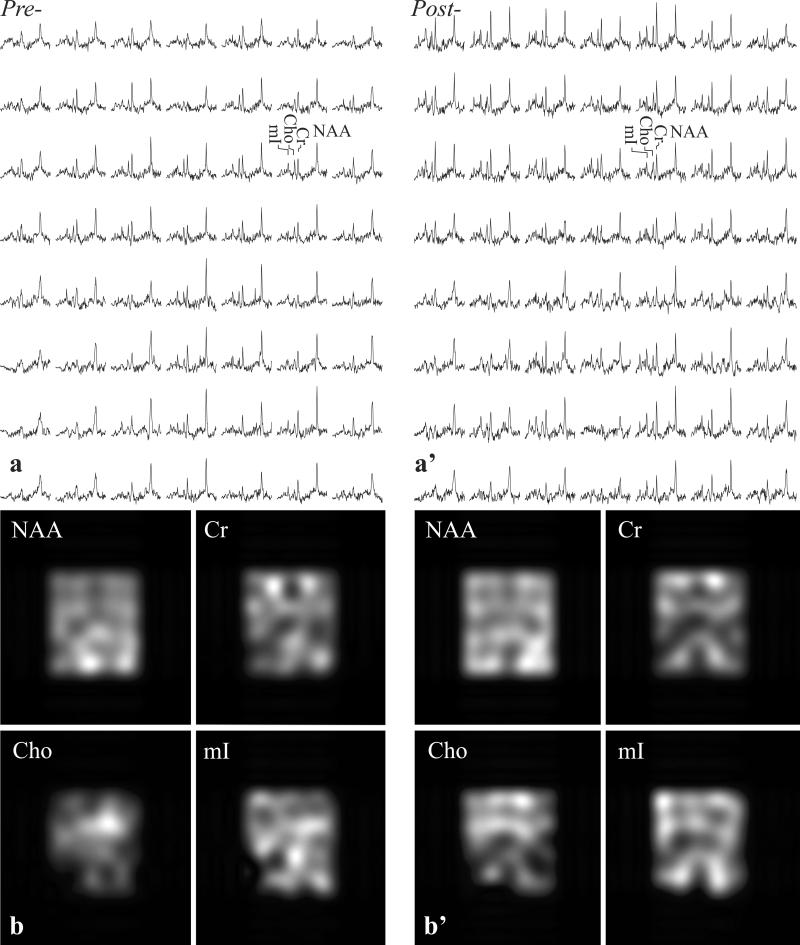
Top: Real part of the 7×8 (LR×AP) 1H spectra matrices from the VOI in Fig. 1a and a’, on common chemical shift and intensity scales pre- (a) and six weeks post- (a’) SIV infection. Note the SNR in those (0.5)3=0.125 cm3 voxels: NAA: 25±8, Cr: 16±6, Cho: 10±3 and mI: 10±4 and spectral resolution, leading to excellent fit reliability reflected by voxel CRLBs below 15% for these four metabolites.
Bottom (b, b’): NAA, Cr, Cho, and mI metabolic maps from the spectra in a, a’. Note the gross anatomical features reflecting spatial localization.

