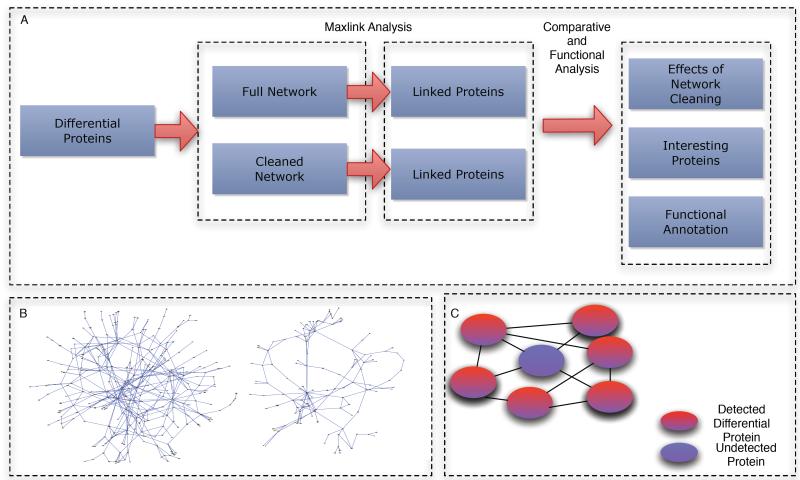
Figure 1.
A) Overview of analytical pipeline. Two sets of networks are used; a cleaned and uncleaned network, to discover linked proteins undetected by the MS screen. The results are then compared using GO coherence measurements and ranks correlation analysis. The set of interesting linked proteins are then functionally annotated using GO terms. B) A cleaned (left) and uncleaned network (right). Note that this is for illustration purposes. The actual networks are too complex to visualize. C) An example of a Maxlinked protein (blue) A Maxlinked protein is one that is highly connected to detected differentially expressed proteins.

