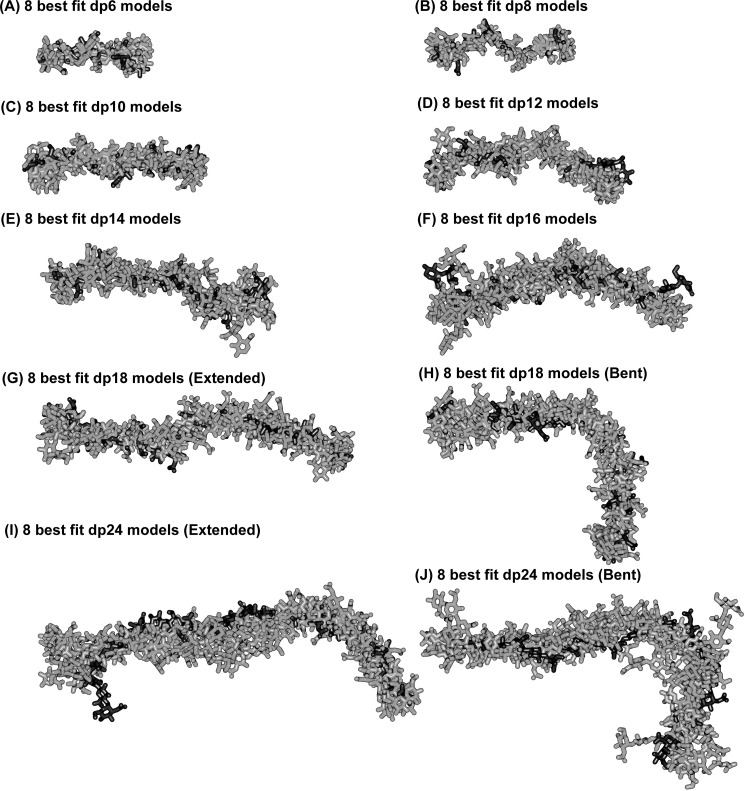
FIGURE 8.
Superimposition of the eight best fit models for each of the eight HS dp6–dp24 fragments. Each set of eight best fit models for the eight HS fragments were superimposed globally using Discovery Studio VISUALISER software, and their non-hydrogen atoms are displayed as shown. Each best fit model from Fig. 7 is shown in black, whereas the seven related best fit structures are shown in gray. For dp18 and dp24, both the overall extended best fit structures (filtering on RG, RXS, and R factor values) and the bent best fit structures (filtering on R factor values only) are shown.

