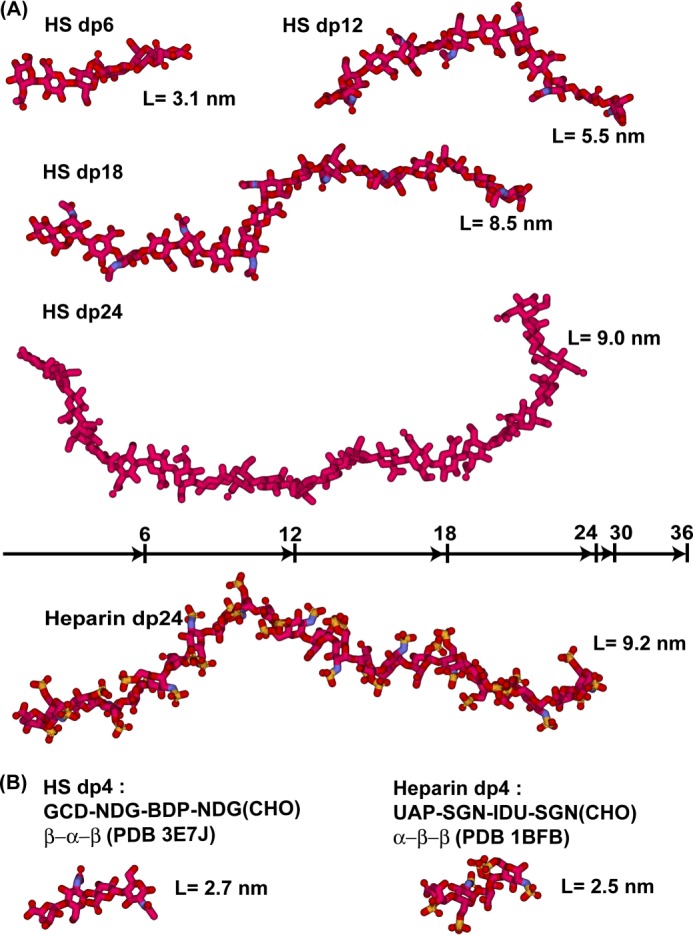
FIGURE 9.

Comparison of the best fit HS dp6–dp24 structures with the equivalent heparin dp6–dp24 structures. Red, carbon and oxygen; blue, nitrogen; yellow, sulfur. A, four best fit HS models (dp6, dp12, dp18 (extended), and dp24 (extended)) are compared with the heparin dp24 model at the bottom all drawn to the same scale. The lengths of heparin dp6, dp12, dp18, and dp24 are indicated above the heparin dp24 structure for comparison with HS. B, the glycosidic linkages in the crystal structure of HS dp4 complexed with heparinase II (PDB code 3E7J) are compared with the crystal structure of the complex of heparin dp4 with fibroblast growth factor (PDB code 1BFB). The anomeric configurations of the glycosidic linkers are shown as α or β.
