FIGURE 2.
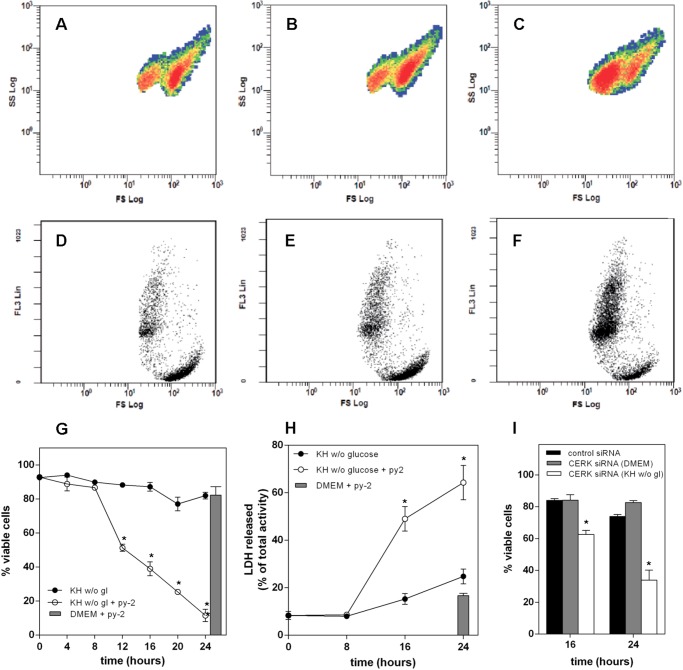
py-2 induces death of nutrient-deprived cells. A–F, LN18 cells were kept for 16 h in DMEM (A and D) or KH without glucose in the absence (B and E) or presence of 1 μm py-2 (C and F), harvested, stained with PI, and analyzed by flow cytometry. A–C show the distribution of 10,000 events for each condition in terms of shape (SS) and size (FS). In all cases, events were distributed in two distinct populations, characterized by a different FS value. Cells kept in DMEM (A) and KH without glucose (B) appeared mostly in the population with a higher FS value, whereas those treated with KH without glucose + 1 μm py-2 (C) were in the low FS population. D–F show the distribution of the same samples in terms of viability, measured according to the ability of cells to exclude PI, which is expressed as FL3, and size (FS). In all cases, the high FS population excluded PI, as evidenced by the lower FL3 fluorescence. py-2 promoted an increase of the PI-stained population. G, LN18 cells were maintained in KH buffer without glucose in the absence (solid symbols) or presence (open symbols) of 1 μm py-2. At the indicated times, cells were harvested, and percentage viability was determined by flow cytometry. Gray bar, viability of cells in DMEM with 1 μm py-2 during 24 h. Inclusion of 1 μm py-2 accelerated the death of nutrient-deprived cells but was not toxic for cells in culture medium. Results are means ± S.E. (error bars) of six independent experiments carried out with duplicate determinations. H, similar results were obtained by determination of LDH activity released to the medium. Results are means ± S.E. of two independent experiments carried out with quadruplicate determinations. *, significantly different from KH buffer without glucose. I, down-regulation of CERK accelerated death of cells kept in KH buffer without glucose (open bars) as compared with control siRNA (solid bars) but had no effect on cells kept in DMEM (gray bars). Results are means ± S.E. of two independent experiments carried out with triplicate determinations. *, significantly different from control siRNA.

