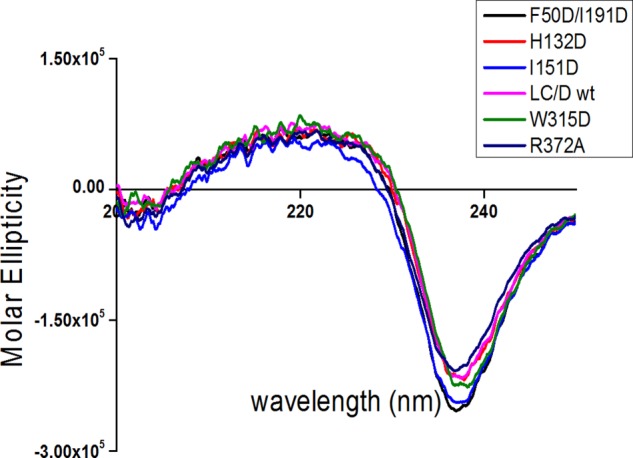
FIGURE 2.

CD spectroscopy analysis of LC/D and its derivatives. Far-UV CD (200–250 nm) data were obtained for LC/D and its derivatives with a JASCO J-810 spectropolarimeter at room temperature. The data for the most representative LC/D derivatives are shown in different colors.
