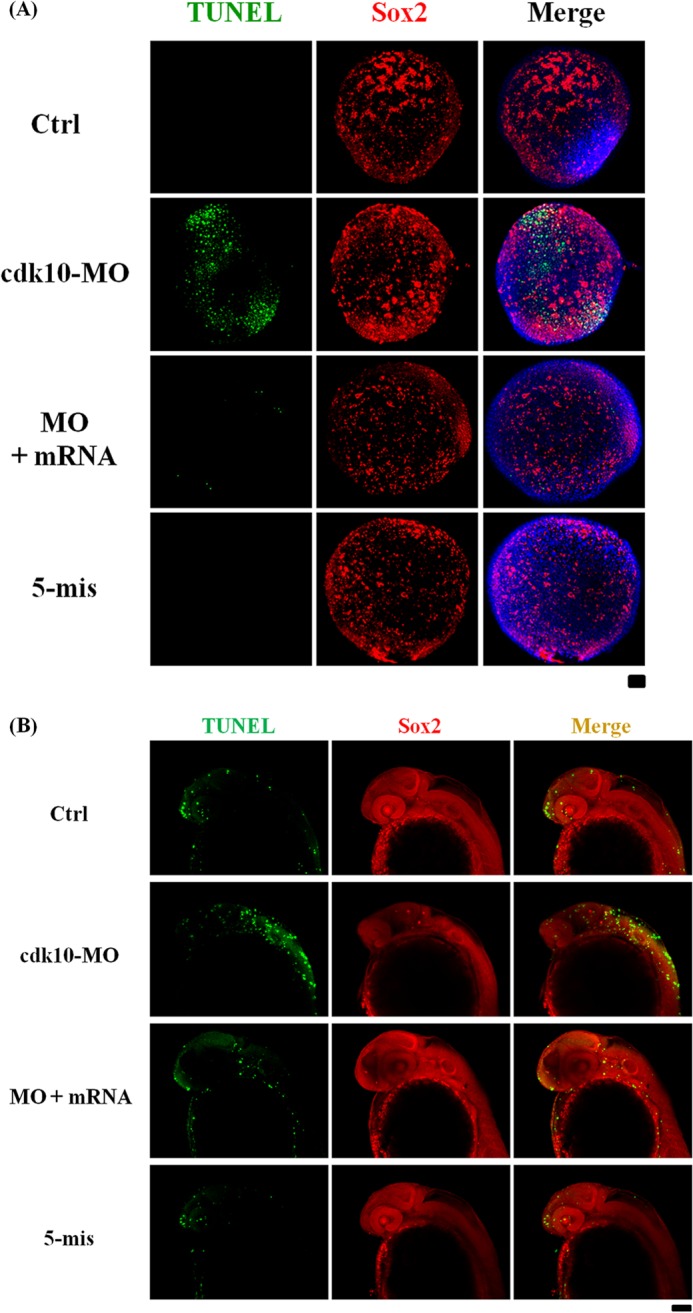
FIGURE 11.

Depletion of cdk10 induced NPC apoptosis. Fluorescent images of TUNEL staining (in green) and sox2 expression (in red) in control (Ctrl), cdk10 MO, MO + mRNA, and 5-mis MO in embryos at 80% epiboly (A) and 24 HPF (B). TUNEL- and sox2-positive cells were co-localized (in yellow), representing apoptotic NPCs (n = 20 embryos each). Scale bars, 100 μm.
