
FIGURE 7.
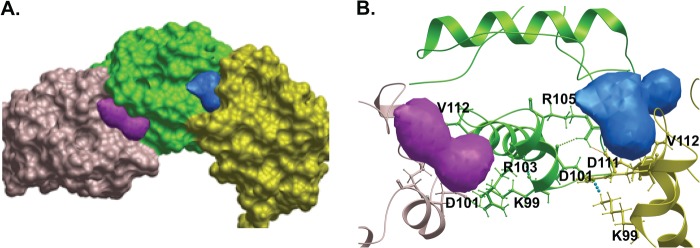
Prediction of two putative small molecule binding pockets adjacent to the salt bridges in the interface of SAM polymer. A, a surface representation of SAM polymer (PDB ID 1JI7) shows the predicted small molecule binding sites (colored in magenta and blue) at the two interfaces of SAM monomers. Three different colors were used to represent individual SAM monomers. B, the ribbon diagram of SAM polymer depicts the predicted pockets formed by the salt bridges between Lys-99–Asp-101 (magenta, left interface) and Arg-103–Asp-111 (blue, right interface). Arg-103 and Val-112 residues also appear to be part of the left pocket. PocketFinder was used to predict the possible small molecule binding sites.