
FIGURE 5.
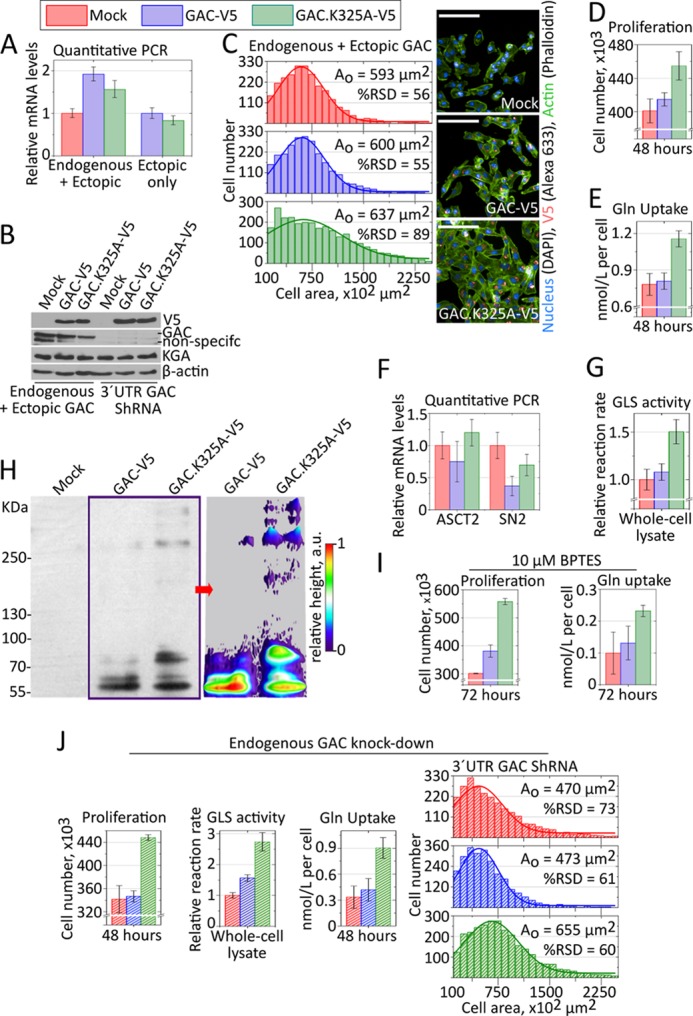
GAC superstructure in cell models. A and B, endogenous and V5-tagged ectopic proteins expressed to similar levels. C–E, a stable MDA-MB 231 clone selected after GAC.K325A-V5 transfection presented larger and more heterogeneous cell area (C), proliferated more (D), and consumed more glutamine from the culture media (E), all compared with cells bearing the V5-tagged wild-type protein or a mock plasmid. F, relative mRNA levels of ASCT2 and SN2 glutamine transporters, as defined by quantitative PCR using rRNA 18 S as a housekeeping gene, showing that the GAC.K325A-V5 cells do not overexpress these transporters. G, glutaminase activity from whole cell lysate, in the presence of 20 mm phosphate, showing consistently higher turnover rates for the GAC.K325A-V5 samples, against the physiological glutamine levels in tumors. H, left panel, step gradient SDS-PAGE (3–15%) followed by immunoblotting (anti-V5) of UV-induced cross-linked intracellular protein with incorporated photo-reactive amino acids, showing the tendency of the GAC.K325A-V5 to form higher molecular weight superstructures within the cells. The UV-induced cross-linking was performed in living, intact cells in culture. Right panel, densitometry was performed in conditions of nonsaturated signal, using ImageJ, to evidence the differential cross-linking of bigger species for GAC.K325A-V5. I, similar to what was observed for the recombinant protein, cells expressing the fiber-prone hyperactive GAC.K325 mutant (GAC.K325A-V5) were less sensitive to BPTES treatment, still proliferating more (left panel) and consuming more glutamine (right panel) than BPTES-treated counterparts. J, the knockdown of endogenous GAC favored the enhancing of the phenotypic differences observed above, better highlighting the outcome from GAC.K325A-V5 expression.