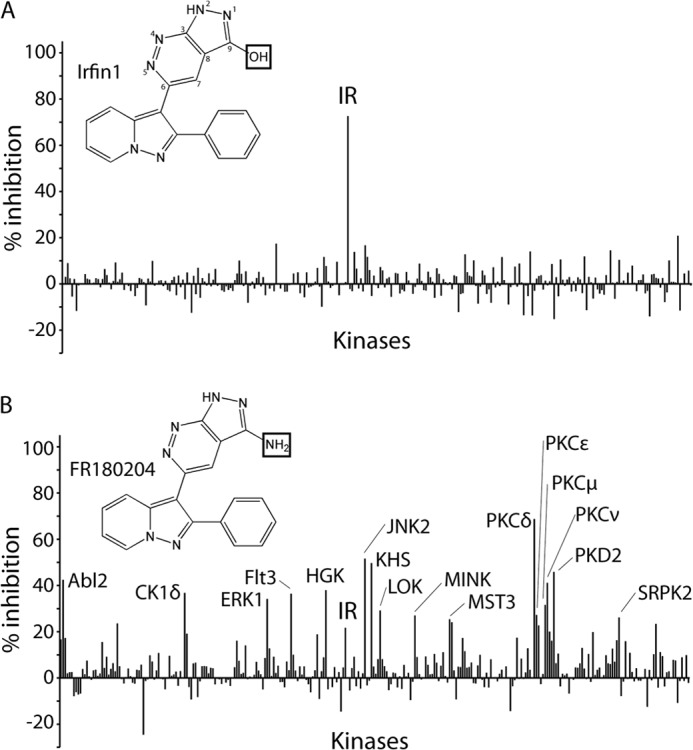
FIGURE 1.

Structure and selectivity of pyrolopyridazine compounds. A, kinase selectivity of Irfin1. Percent inhibition relative to solvent control reactions is plotted for each of 290 kinases incubated with 0.5 μm Irfin1. Kinases inhibited by >25% are indicated. The chemical structure of Irfin1 is shown with the positions of the pyrazolopyridine ring numbered. B, kinase selectivity of FR180204. Reactions were conducted and are presented as described in A. The complete data set is provided in supplemental Table 1. The boxes in the chemical structures of Irfin1 and FR180204 indicate structural differences between the compounds.
