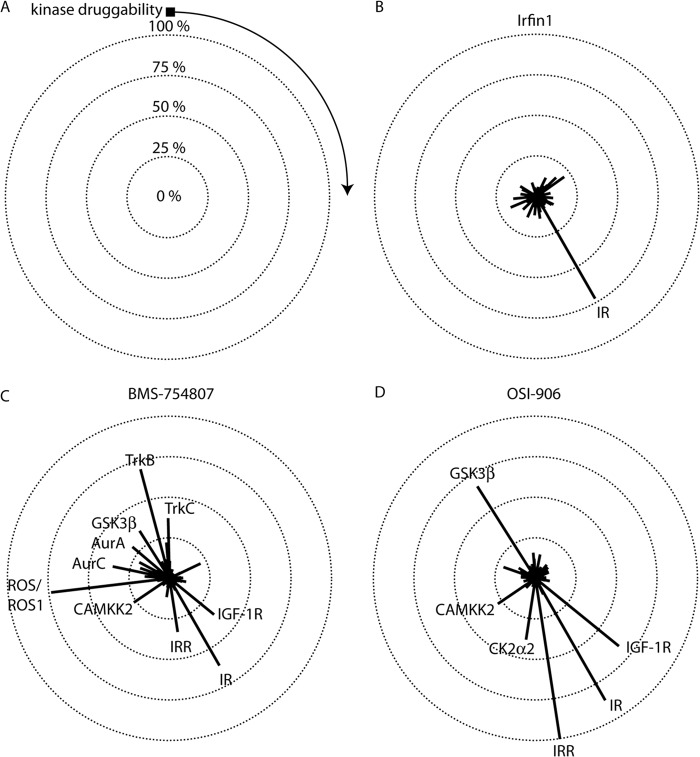
FIGURE 5.
Inhibitor selectivity profiling. Inhibitors were screened against a panel containing 290 human protein kinases at their IC73 for IR. A, selectivity data are represented in a radial plot where the lengths of radii correspond to the percent inhibition of kinases in the panel. Kinases with negative inhibition values were truncated to 0. Kinases are arranged in a clockwise fashion and are ranked in order of kinase druggability as defined previously (Ref. 10). The black square indicates kinases that were not found to be sensitive to small-molecule inhibition, and the direction of increasing druggability is indicated by the arrow. Concentric circles denote the level of inhibition. The center of all of the circles denotes 0% inhibition. Kinases that are inhibited by >25% are indicated on each plot. Complete screening data is provided in supplemental Table 1. B, Irfin1. (Note that this radial plot and the linear plot in Fig. 1A are generated from the same data.) C, BMS-754807. D, OSI-906.

