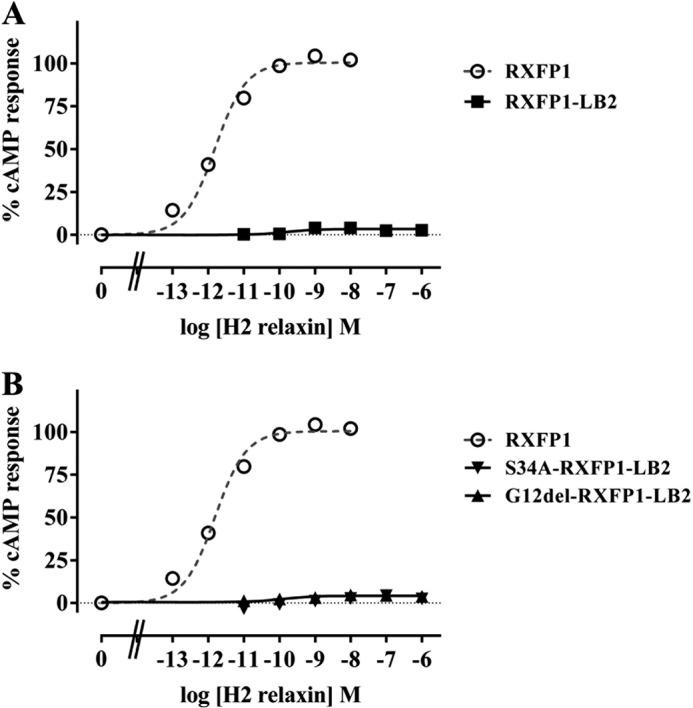
FIGURE 3.

H2 relaxin-induced cAMP response of RXFP1-LB2 (A) and G12del-RXFP1-LB2 and S34A-RXFP1-LB2 (B) compared with RXFP1. cAMP activity is expressed as the percentage of the 5 μm forskolin-stimulated response for each receptor and has been normalized for cell surface expression. Symbols represent means and vertical bars (not visible) represent S.E. of triplicate determinations from at least three independent experiments.
