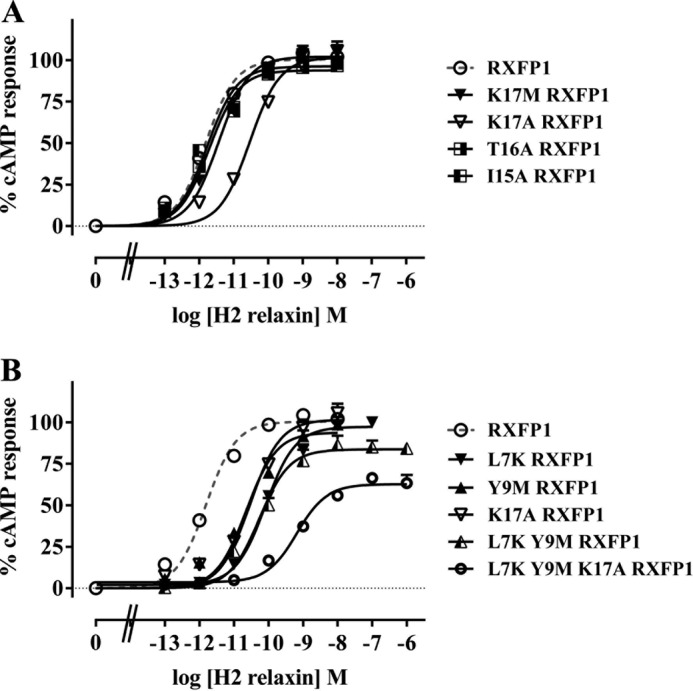
FIGURE 6.

H2 relaxin-induced cAMP response of I15A-RXFP1, T16A-RXFP1, K17A-RXFP1, and K17M-RXFP1 (A) and L7K-RXFP1, Y9M-RXFP1, K17A-RXFP1, L7K/Y9M-RXFP1, and L7K/Y9M/K17A-RXFP1 (B) compared with RXFP1. cAMP activity is expressed as the percentage of the 5 μm forskolin-stimulated response for each receptor and has been normalized for cell surface expression. Symbols represent means and vertical bars represent S.E. of triplicate determinations from at least three independent experiments.
