FIGURE 6.

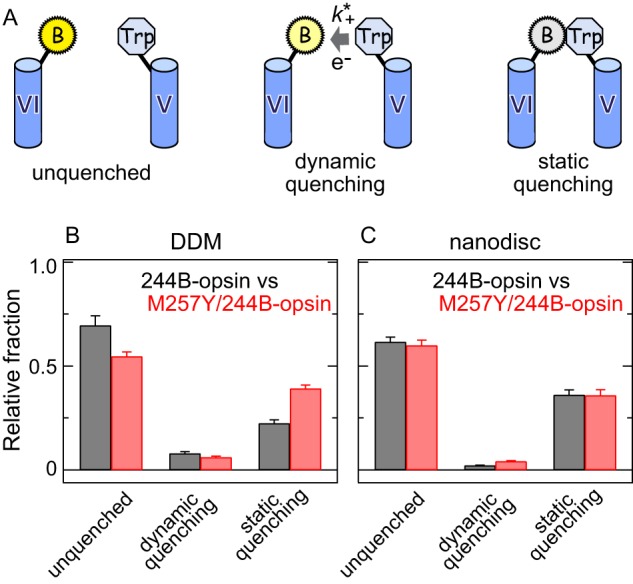
The M257Y CAM shifts the population of receptor conformations toward active ones, as indicated by the changes in the amount of static and dynamic quenching of the bimane at site 2446.27 by the Trp at site 2315.66. A, schematic scheme of the different quenching species that can be detected by TrIQ analysis; unquenched, dynamic quenching, and static quenching. B and C, steady-state fluorescence data in Fig. 5 with the fluorescence lifetime data allows calculation of the relative fraction of unquenched, dynamically quenched, and statically quenched in 244B-opsin (black) and M257Y/244B-opsin (red) in DDM micelles (B) and in nanodiscs (C). The error bars represent the S.E. for three independent experiments. The calculation of different quenching fractions is described under “Experimental Procedures,” using the Fw/Fo values shown in Fig. 5, and the following ratio of average fluorescence lifetimes (〈τo〉/〈τw〉) obtained from three exponential fitting of the decay data: 244B in DDM (1.09 ± 0.02), 244B in nanodiscs (1.04 ± 0.01), M257Y/244B in DDM (1.13 ± 0.01), M257Y/244B in nanodiscs (1.07 ± 0.01). The experiments were carried out at 10 °C.
