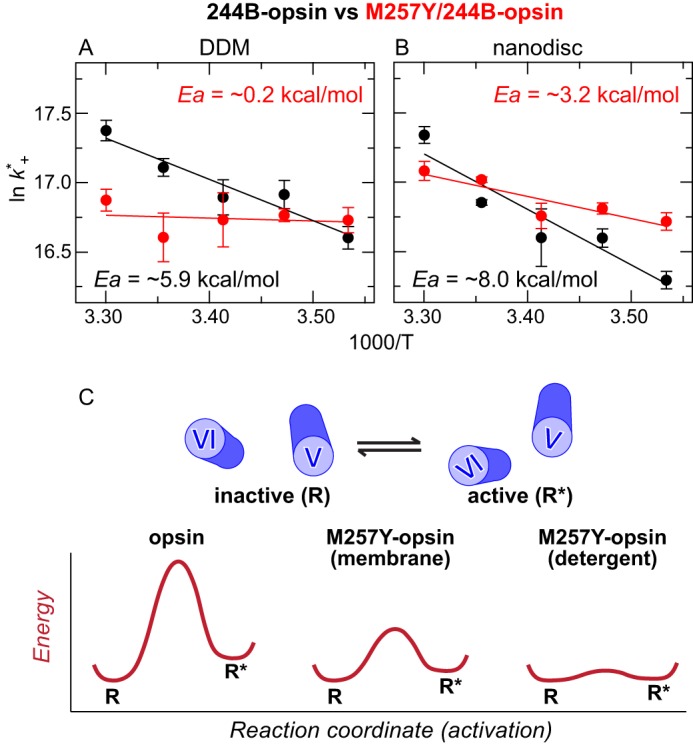
FIGURE 7.

The M257Y CAM appears to lower the activation energy for TM5/TM6 movement. A and B, Arrhenius plots of the dynamic quenching constants (k+*) of the Trp at position 2315.66 and the bimane probe at position 2446.27 in opsins as a function of temperature. Calculation of k+* values were obtained using the single lifetime values obtained from analyzing the decay using a stretched exponential function (I(t) = αexp(−t/τ)β) (29). The τw and τo values used are reported in supplemental Table S1. Black and red circles indicate 244B-opsin and M257Y/244B-opsin, respectively, in DDM (A) and nanodiscs (B). The calculated Ea values of 244B-opsin (black) and M257Y/244B-opsin (red) are provided. The error bars represent the S.E. for three independent experiments. Further details are provided under “Experimental Procedures.” C, simplified two-dimensional energy landscape of opsin with or without M257Y CAM. This schematic shows the energy of the receptor conformations is plotted along the activation pathway (2). Note that virtually the same conclusion was obtained from Arrhenius plots based on k+* values that were calculated using either averaged lifetime values (〈τ〉), or the long-lifetime component obtained from a bimodal Lorentzian distribution.
