FIGURE 2.
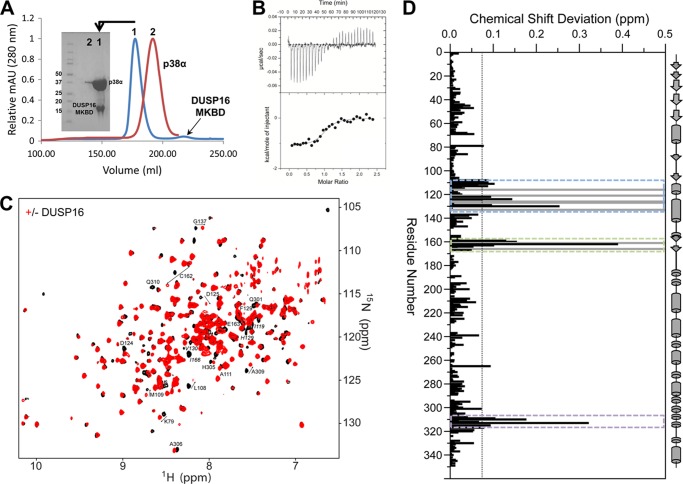
p38α engages the DUSP16 MKBD via the KIM binding pocket, the ED site, and the CD site. A, Superdex 75 26/60 SEC chromatograms are shown for p38α (red) and the p38α·DUSP16 MKBD complex (blue). The SDS-PAGE gel shows that p38α is bound to the DUSP16 MKBD in a 1:1 stoichiometric ratio and that the complex is highly pure. mAU, milliabsorbance units. B, raw isothermal titration calorimetry data (upper panels) and derived binding isotherm plotted versus the molar ratio of titrant fit using a one-site model (lower panels) for p38α with the DUSP16 MKBD. C, two-dimensional 1H,15N TROSY spectrum of p38α in the presence (red) and absence (black) of the DUSP16 MKBD. D, histogram showing the combined 1H/15N CSPs versus p38α residue upon DUSP16 MKBD binding. Residues that form the p38α KIM binding pocket (blue dashed lines), ED site (green dashed lines), and CD site (purple dashed lines) are highlighted. Residues with peak line widths broadened beyond detection upon titration are colored in gray.

