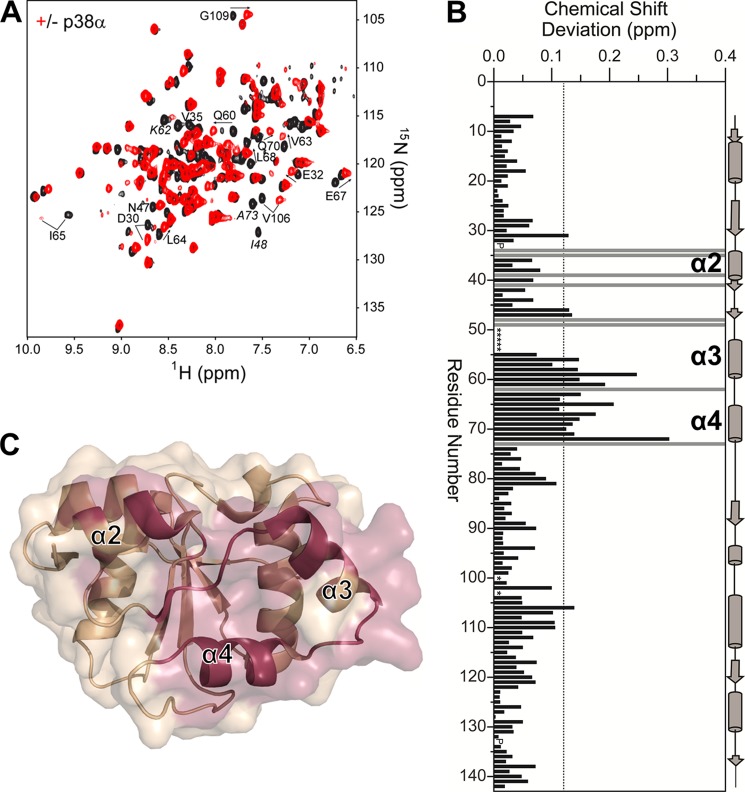
FIGURE 3.
The DUSP16 MKBD interacts with p38α via helices α2, α3, and α4. A, two-dimensional 1H,15N TROSY spectrum of the DUSP16 MKBD in the presence (red) and absence (black) of p38α. Some residues with significant CSPs are labeled. Residues exhibiting line broadening beyond detectability are annotated in italics. B, histogram showing the combined 1H/15N CSPs versus DUSP16 MKBD residue upon p38α binding. The DUSP16 MKBD helices α2, α3, and α4 are highlighted. Residues with peak line widths broadened beyond detection upon titration are colored in gray. Proline residues are indicated as P, and unassigned residues in the unbound DUSP16 MKBD are denoted by asterisks. C, graphic surface structure of the DUSP16 MKBD (PDB ID 2VSW). Residues with CSPs or that are broadened beyond detectability are colored in red.

