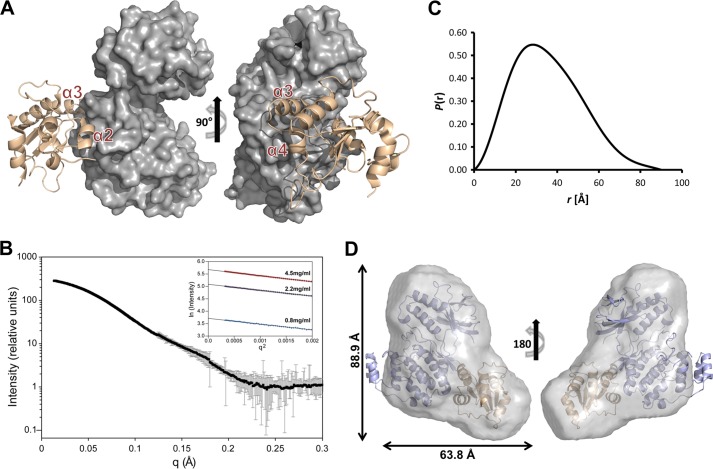
FIGURE 4.
The p38α·DUSP16 MKBD complex. A, the lowest energy HADDOCK model of the p38α·DUSP16 MKBD complex. DUSP16 MKBD helices α2, α3, and α4 are highlighted. B, SAXS data (I(q) versus q) of the p38α·DUSP16 MKBD complex (black circles) with error bars (gray lines). Error bars show the experimental error based on circular averaging of the two-dimensional solution scattering data. Inset, Guinier plots for samples at 0.8, 2.2, and 4.5 mg/ml. C, P(r) function of the p38α·DUSP16 MKBD complex. D, ab initio molecular envelope (maximum dimensions are indicated) generated by GASBOR for the p38α·DUSP16 MKBD complex fitted with the lowest energy HADDOCK model of the p38α·DUSP16 MKBD complex.

