FIGURE 2.

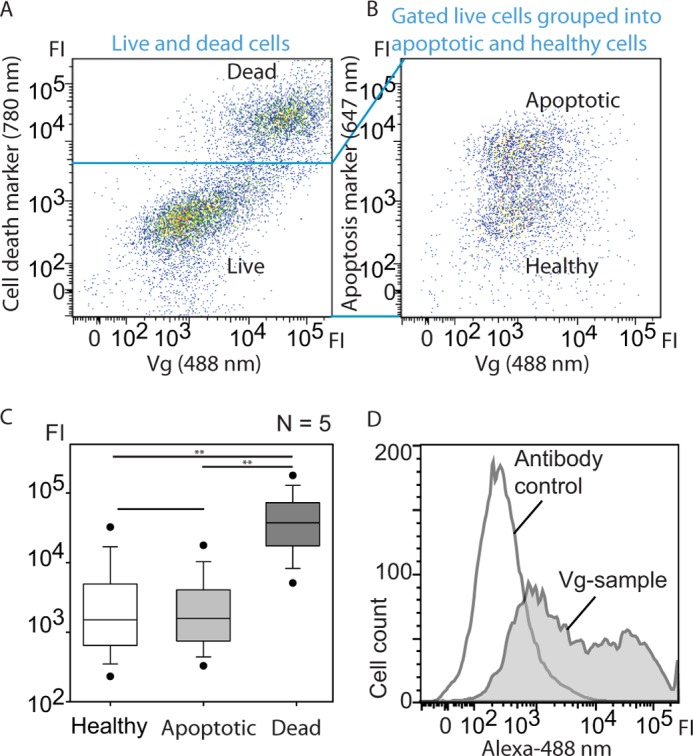
Vg was incubated with High Five insect cells, and the binding was verified by FACS, which revealed high Vg affinity to dead cells. A and B, dot plots of Alexa-488-labeled Vg versus death cell marker (A, Viability Dye®, eBioscience) or apoptosis marker (B, annexin V Alexa-647). The emission wavelengths of the fluorescent dyes are indicated. Each dot represents a single cell, and the color gradient shows the cell density. FI, fluorescence intensity. A, high vitellogenin signal co-localizes with cell death marker, indicating high affinity with dead cells. B, the area in B corresponds to an enlargement of the live cell plot in A. Live cells were separated into early apoptotic (high annexin V fluorescence intensity) and healthy cells that both bind Vg. C, statistical presentation of the fluorescence intensities of the n = 5 measurements. Vg binding to dead cells is significantly higher than to healthy or early apoptotic cells. Error bars, S.E. D, Vg-incubated cell sample versus background control. Control cells were incubated with the Alexa-488 antibody only.
