
FIGURE 8.
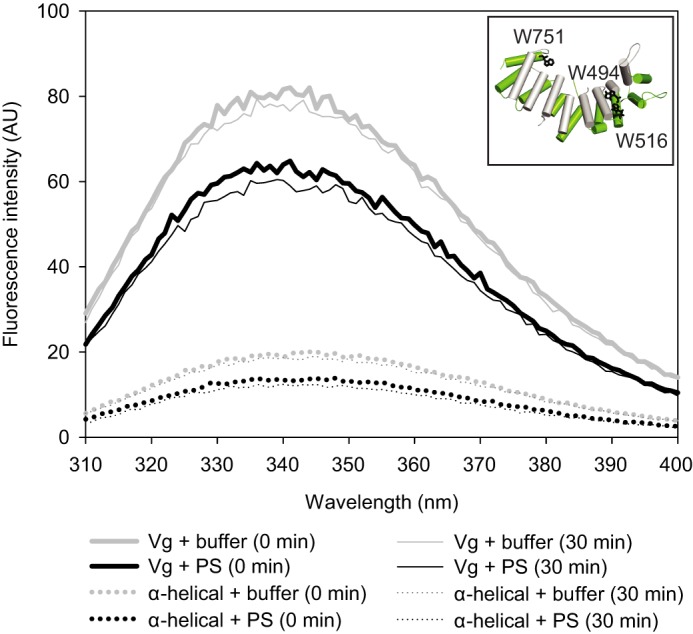
Tryptophan fluorescence of vitellogenin (solid line) and its α-helical domain (dotted line) upon liposome binding. The three tryptophan residues of the α-helical domain are indicated as black sticks in the model (inset). The fluorescence intensity of the protein samples was measured at time 0 (thick lines) and after 30 min (thin lines). Samples with no liposomes are shown in gray, and the samples with PS liposomes are shown in black. Liposomes appear to quench the tryptophan signal, but no shifts in the tryptophan emission peaks were observed. Protein-free blanks were measured in parallel with the samples, and the curves are blank-subtracted. The curves represent the average of three parallel measurements.