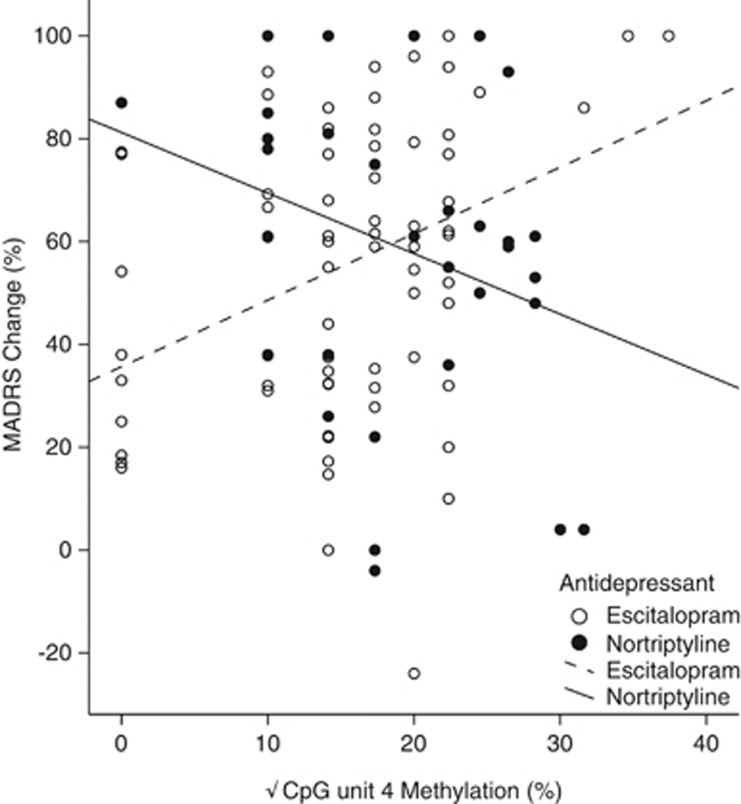
Figure 4.
Scatter plot of the relationship between percentage DNA methylation at CpG unit 4 (x-axis) and percentage Montgomery-Åsberg Depression Rating Scale (MADRS) change (y-axis). Lines represent line of best fit for each drug group. DNA methylation at CpG unit 4 was found to significantly interact with the drug type to predict percentage MADRS change in our model (P=0.005).

