
Figure 3.
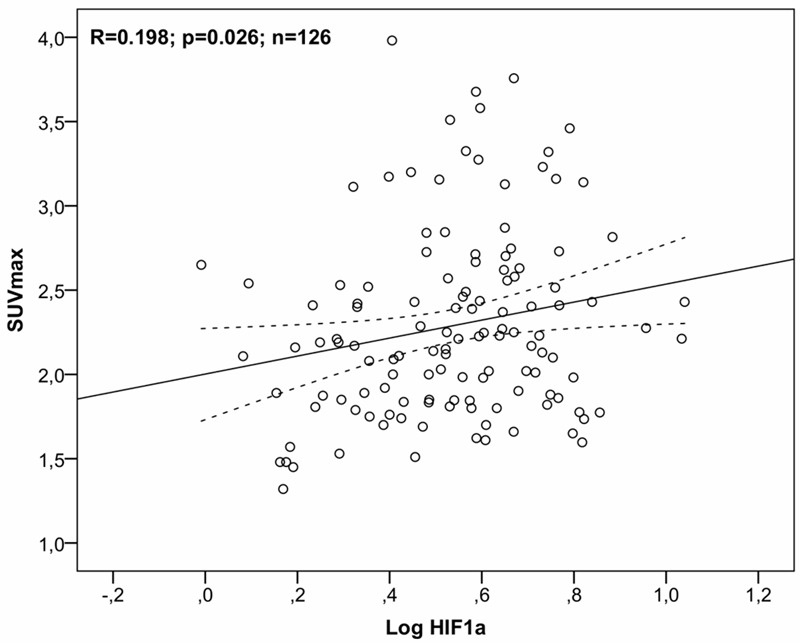
Gene expression; correlation to SUVmax. Univariate linear regression analysis of gene expression of HIF-1α relative to SUVmax as an expression of 18F-FDG-uptake for all patients and all lesion slices (n = 126). Note log-transformation of gene expression data. The 95% confidence interval is indicated by the broken line. 18F-FDG = 2-[18F] fluoro-2-deoxy-D-glucose; HIF-1α = hypoxia inducible factor 1α; SUVmax = maximum standardized uptake value.