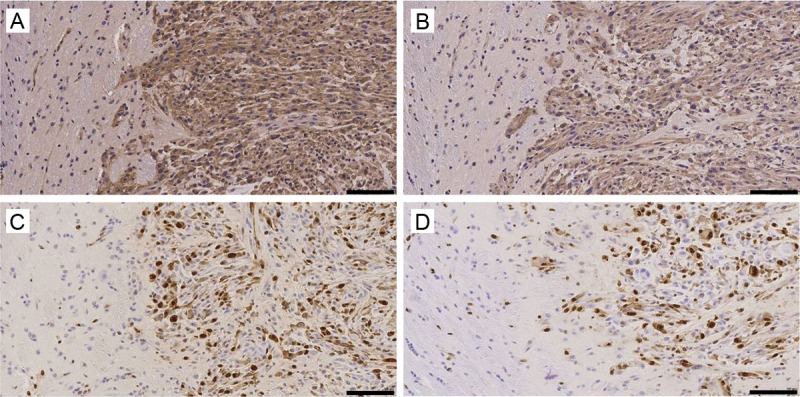
Figure 7.

Representative tumor sections were taken from both treated and vehicle treated tumors 22 days after initiation of the therapy regime. Sections from the vehicle treated tumors were analysed for MVD using CD31 staining (A) and proliferation using Ki67 staining (C) and compared to sunitinib treated CD31 staining (B) and Ki67 stained sections (D, — = 100 μm).
