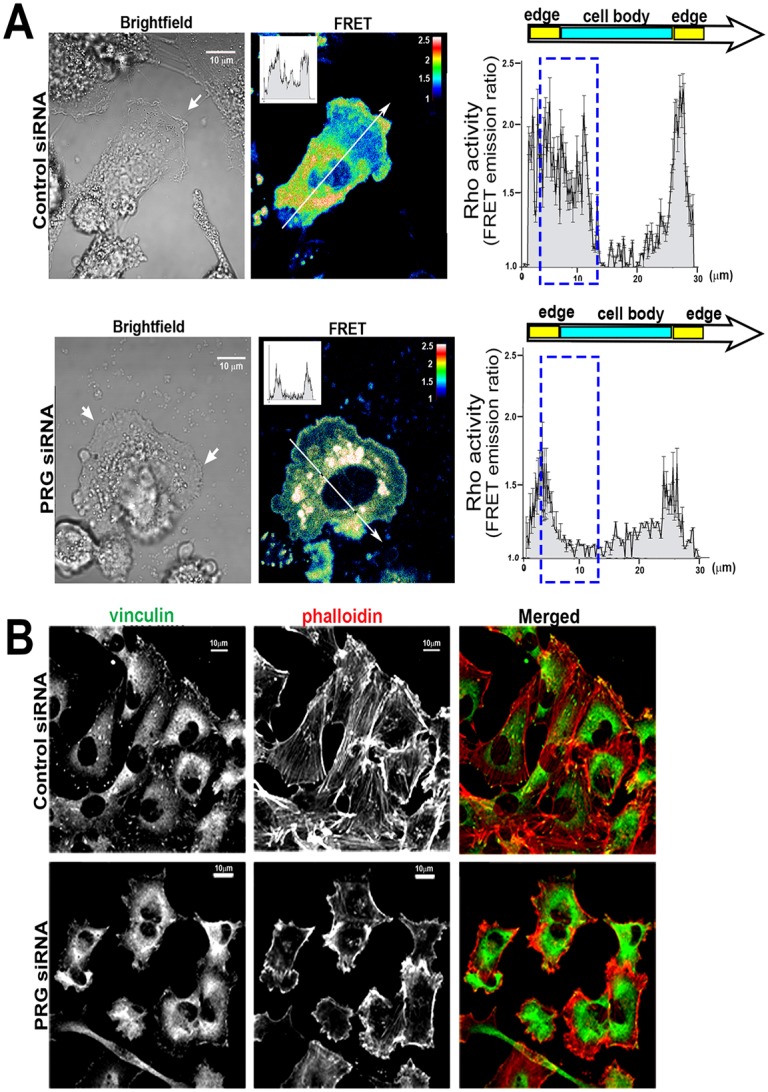
Fig. 6.

PRG knockdown causes redistribution of RhoA activity and cytoskeletal defects in the MDA-MB-231 cell line. (A) MDA-MB-231 cells stably expressing the RhoA FRET biosensor were transfected with control or PRG siRNA and imaged as described in Fig. 5. Control cells show asymmetric distribution of RhoA activity with high RhoA activity localized to the protrusive front, and the cell body from the nucleus to the rear of the cell. In PRG-depleted cells, total RhoA activity appears reduced and the polarized distribution is lost and is instead found in a thin band at the periphery and in regions of the cytoplasm. RhoA activity plotted along the length of control or PRG-deficient cells (n = 18, 2 lines/cell, 3 cells/condition, n = 3) is shown on the right. Dashed rectangles highlight areas of FRET emission (RhoA activity) change in the cell body. Inset graphs in the FRET images are intensity plots for the representative lines drawn in the main images. (B) Representative immunofluorescence images of PRG-deficient MDA-MB-231 cells plated on collagen-coated coverslips, fixed, and probed with anti-vinculin and Alexa-Fluor-488–phalloidin. An overlay of vinculin (green) and phalloidin (red) labeling is shown in the ‘merged’ image. Scale bars: 10 µm.
