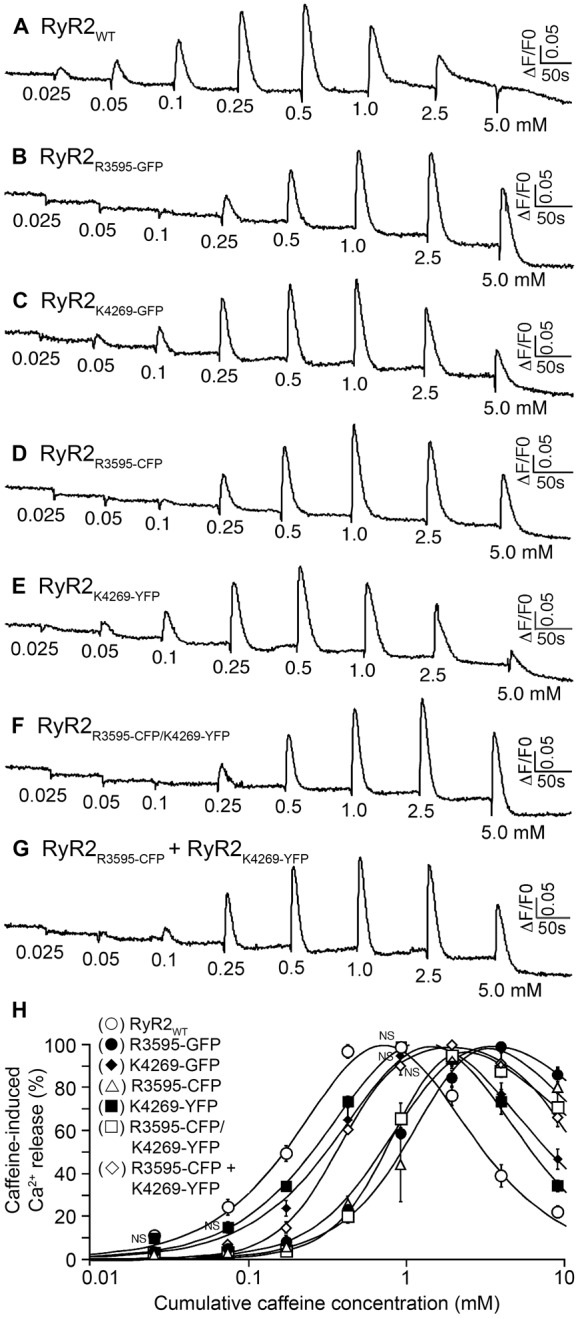
Fig. 2.

Functional characterization of RyR2s labeled with GFP, CFP or YFP. HEK293 cells were transfected with RyR2WT (A), RyR2R3595-GFP (B), RyR2K4269-GFP (C), RyR2R3595-CFP (D), RyR2K4269-YFP (E), or RyR2R3595-CFP/K4269-YFP (F), or co-transfected with both RyR2R3595-CFP and RyR2K4269-YFP cDNAs (G). Fluorescence intensity of fluo-3-AM-loaded transfected cells was monitored before and after the additions of various concentrations of caffeine. The numbers (under the traces) indicate caffeine concentrations. Traces shown are from representative experiments. (H) Ca2+ release in relation to cumulative caffeine concentration in transfected HEK293 cells. Data shown are means ± s.e.m. (n = 3). Except for those labeled ‘NS’ (not significant), all other data points of GFP-, CFP- or YFP-labeled RyR2 are significantly different from that of RyR2WT for a given caffeine concentration (P<0.05).
