Fig. 3.

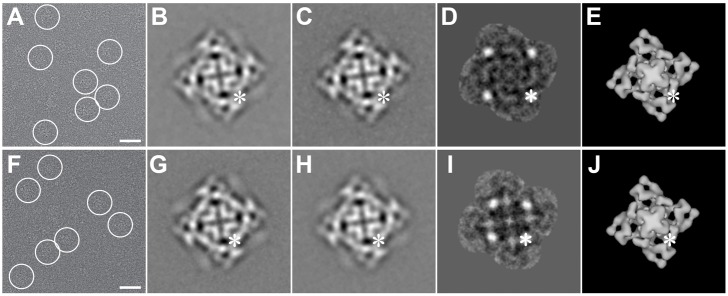
Two-dimensional analysis of RyR2R3595-GFP and RyR2K4269-GFP. (A,F) Cryo-EM CCD image of RyR2R3595-GFP and RyR2K4269-GFP, respectively, showing protein particles embedded in a thin layer of vitreous ice. The tetrameric structure of RyR2 is well preserved, and several individual particles are marked with circles. Scale bars: 500 Å. (B,G), 2D average of RyR2R3595-GFP and RyR2K4269-GFP, respectively, determined from 321 and 300 selected individual particles with defocus value ranges between −2.8 and −3.2 µm and between −2.8 and −3.6 µm, respectively. (C,H), 2D average of RyR2WT control from 380 and 333 particles in the same defocus range as were used for B and G, respectively. (D,I) The difference map obtained by subtracting the image in C from the image in B and the image in H from G, respectively. Bright white spots represent positive differences (one spot is highlighted by an asterisk), which correspond to the four extra masses contributed by GFP insertion. The images shown in B–D and G–H represent the projection of RyR as seen from the lumen side of the sarcoplasmic reticulum, which is shown for 3D models in E and J. The asterisk highlights the location of GFP within the plane of projection. The width of frames in B–J is 544 Å.
