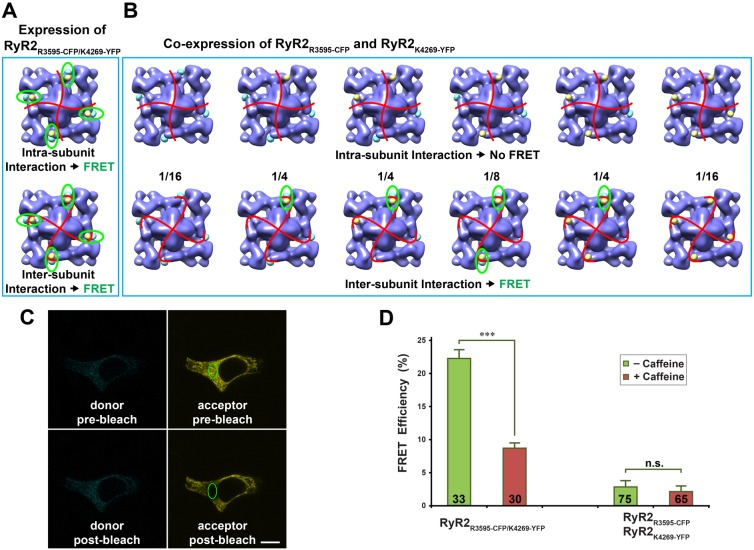
Fig. 5.
Dynamic interaction between two CaM-binding sequences characterized by FRET analysis. (A) Structural model of the dual insertion RyR2R3595-CFP/K4269-YFP. The cyan and yellow spheres represent CFP and YFP, respectively. Each RyR2 molecule contains four FRET pairs (highlighted by green ellipses). Red curves represent a possible boundary between the four subunits. FRET signals will be detected regardless of whether two structural domains bearing R3595-CFP and K4269-YFP are contained within one RyR2 subunit (i.e. an intra-subunit interaction, top panel) or belong to two different subunits (i.e. an inter-subunit interaction, bottom panel). (B) Models of six possible hybrid RyR2 tetramers when two cDNAs encoding RyR2R3595-CFP and RyR2K4269-YFP are co-expressed. The top row shows six RyR2 tetramer structures for the situation in which two structural domains bearing R3595-CFP and K4269-YFP are contained within one RyR subunit. In this case, no FRET signal will be detected, since the distance between CFP and YFP in the two neighboring subunits is over 180 Å. The bottom row shows six RyR2 tetramer structures for the case in which the two structural domains bearing R3595-CFP and K4269-YFP belong to two different subunits. In this case, four out of six structures have at least one FRET pair (highlighted by green ellipses). Numbers between two rows are the mathematical probability ratios for the six possible structures, assuming that RyR2 tetramers formed by random assembly of the two differently labeled subunits. (C) Confocal images of a HEK293 cell expressing RyR2R3595-CFP/K4269-YFP cDNA, showing cyan and yellow fluorescence before and after photobleaching. The green ellipse demarcates the area selected for photobleaching. Scale bar: 10 µm. (D) FRET efficiency determined by photobleaching of acceptor. Data are means ± s.e.m., with the number of the cells indicated on the bars. ***P<0.001; n.s., not significant.

