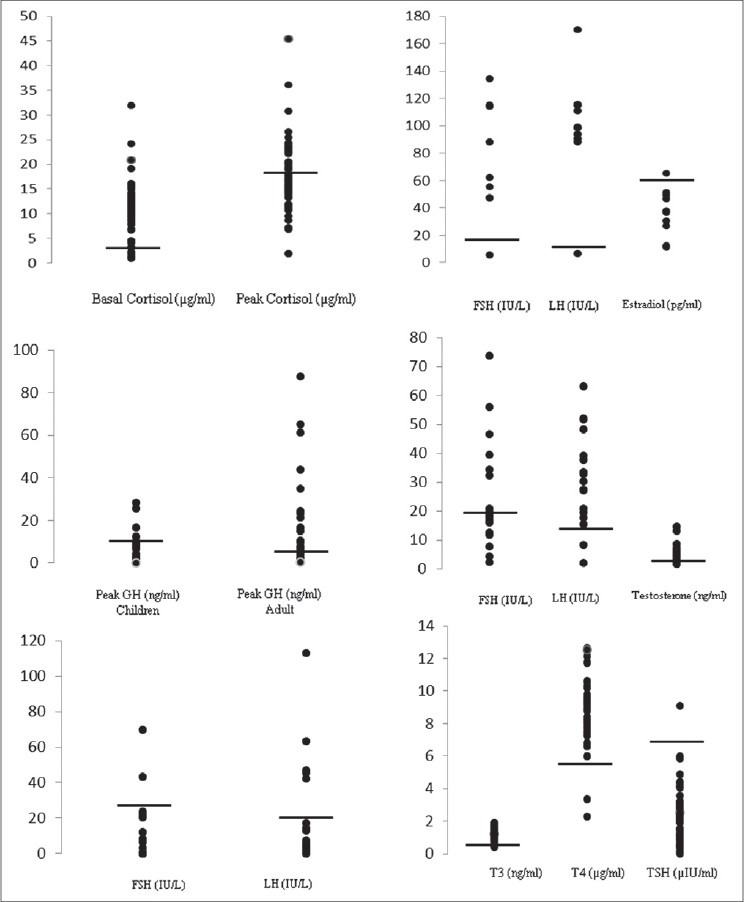
Figure 2.

Hormonal values in the study group. A: Basal and Peak cortisol after insulin tolerance test (ITT); B: Peak growth hormone after ITT in children and adults; C: Gonadal hormone pattern in Children; D: Gonadal hormone pattern in females; E: Gonadal hormone pattern in males; E: Thyroid function test
