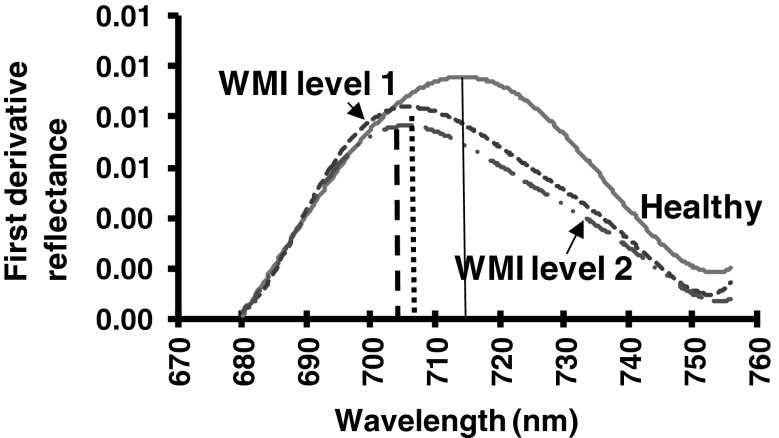
Fig. 6.
Red edge peak and amplitude in soybean leaves showing yellow mosaic disease due to Mungbean yellow mosaic India virus infection. Wavelength and amplitude of the red peak for each infection level were estimated through linear interpolation technique by fitting a second order polynomial equation to the red-infrared slope. (Color figure online)

