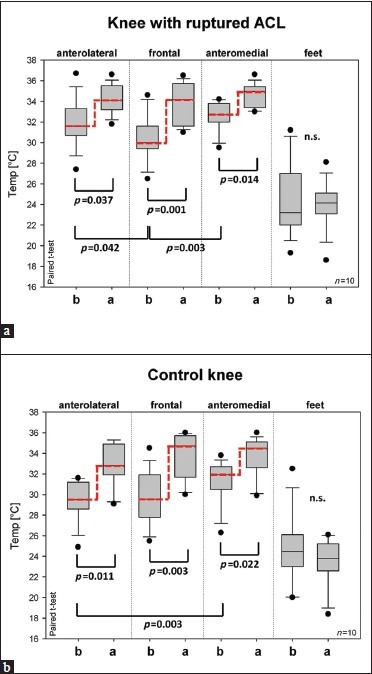
Figure 5.

Changes of body surface temperature in 10 patients before and after manual therapy. Thermal data of injured (a) and control (b) knee. Ends of the boxes: 25th and 75th percentiles with a line at the median, error bars: 10th and 90th percentiles. b … before manual therapy; a … after manual therapy
