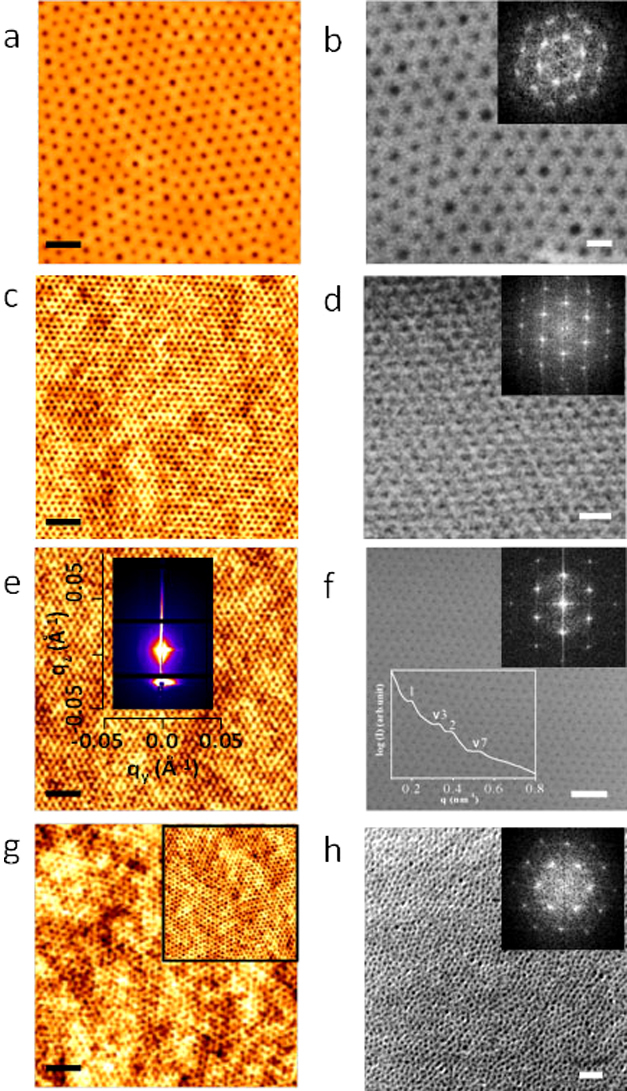
Figure 1. AFM and SEM images of microphase separated dot patterns after solvent annealing for different molecular weight PS-PEO systems (a), (b) 102 k–34 k, (c), (d) 42 k–11.5 k, (e), (f) 32 k–11 k and (g), (h) 16 k–5 k respectively.

Insets of (b), (d), (f), (h) represents corresponding FFT patterns. Insets of (e), (f) shows GISAXS 2D pattern and intensity profile with respect to the peak position. (a), (c), (e), (g) scale bar: 200 nm. (b), (d), (f), (h) scale bar: 100 nm.
