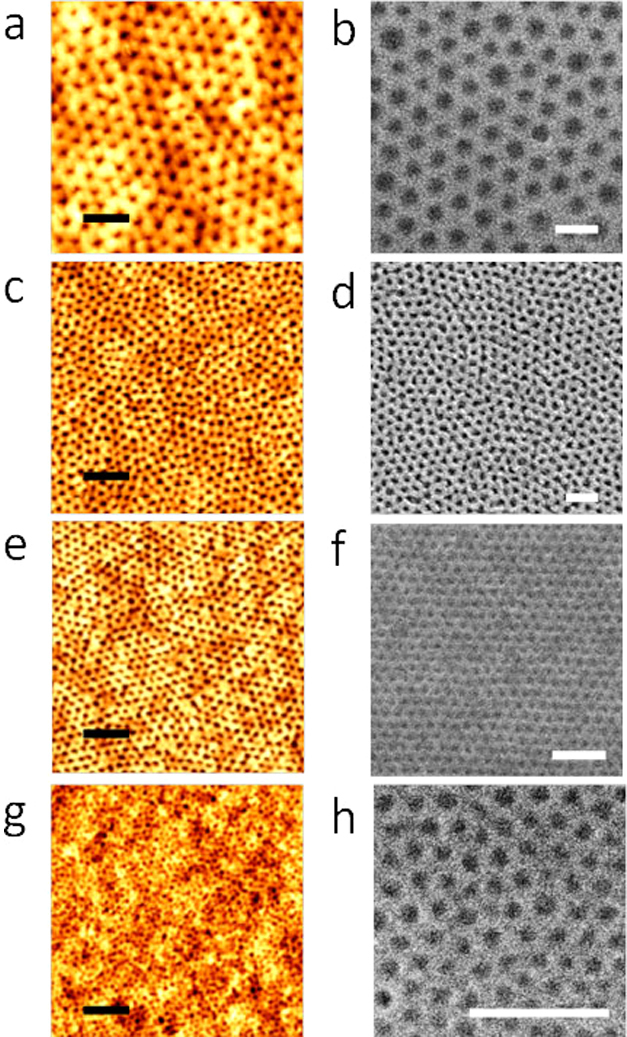
Figure 2. AFM and SEM images of the nanoporous template after ethanol ultrasonication for different periods of time (a), (b) 102 k–34 k, 20 min (c), (d) 42 k–11.5 k, 17 min (e), (f) 32 k–11 k, 15 min and (g), (h) 16 k–5 k, 10 min respectively.

(a), (c), (e), (g) scale bar: 200 nm. (b), (d), (f), (h) scale bar: 100 nm.
