Figure 4.

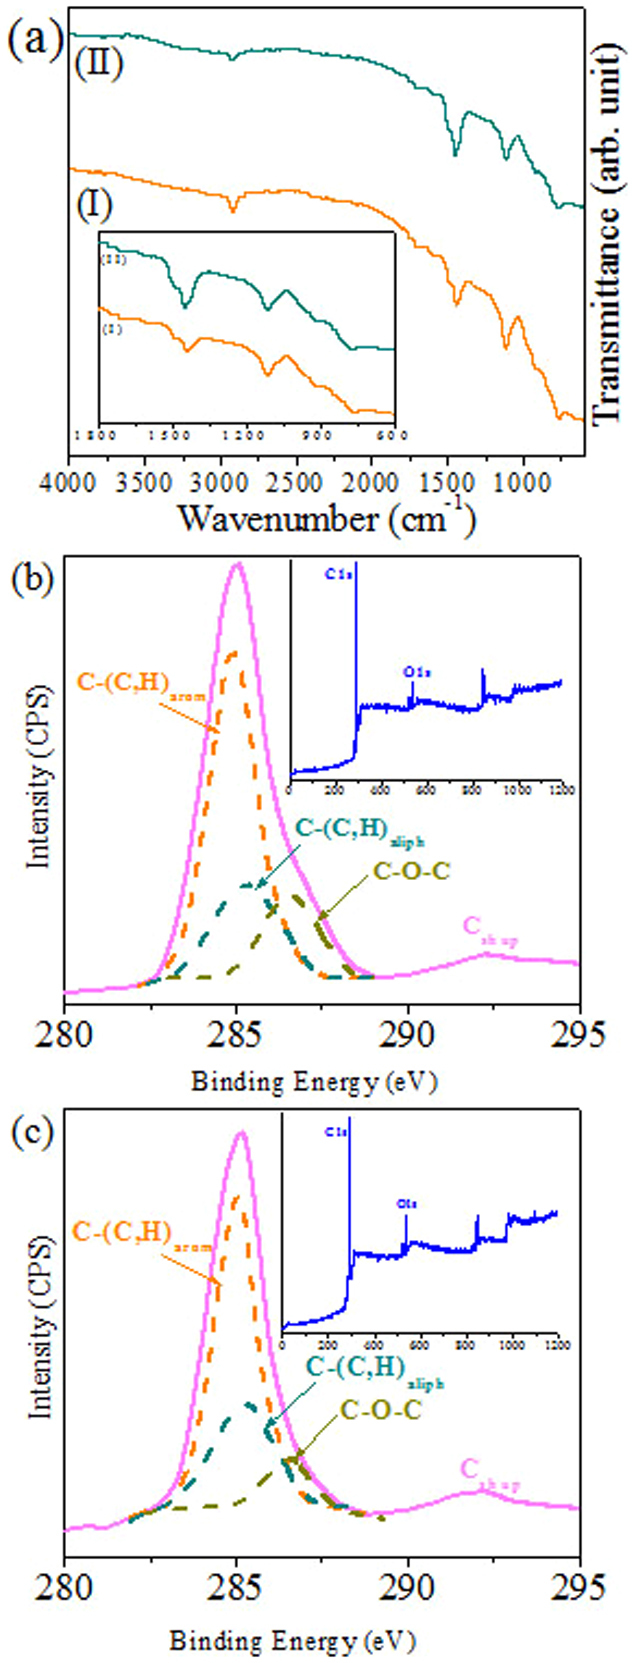
(a) FTIR and (b), (c) C1s core level spectra of the PS-PEO hexagonal dot patterns before and after ethanol treatment for 32 k–11 k. Insets of (b and c) show corresponding survey spectra.

(a) FTIR and (b), (c) C1s core level spectra of the PS-PEO hexagonal dot patterns before and after ethanol treatment for 32 k–11 k. Insets of (b and c) show corresponding survey spectra.