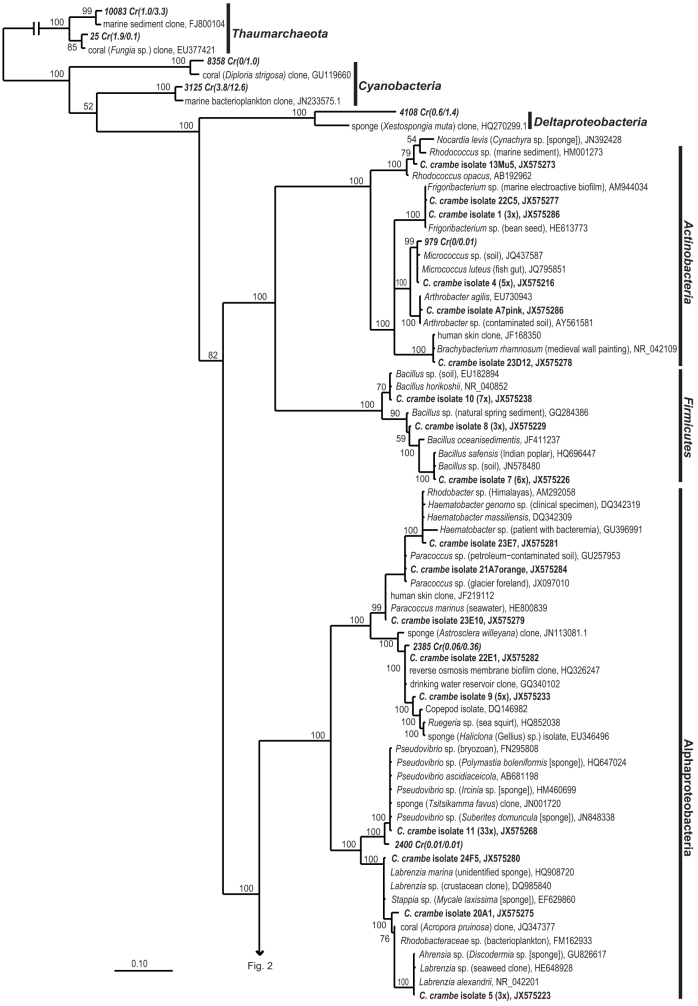
Figure 1. Bayesian phylogram based on 16S rRNA gene sequences from C. crambe isolates (in bold), selected pyrosequencing-based OTUs of C. crambe associated microorganisms (in italic) and nearest neighbours.
When isolate-derived OTUs consist of more than one isolate, a representative sequence is included in the tree and the number of isolates represented by the OTU is included in parentheses. For cultivation independent OTUs the relative abundance in Crambe 1 and Crambe 3, respectively, is included in parentheses. The numbers above or below the branches correspond to posterior probability (PP) values of the Bayesian analysis. The scale bar corresponds to the mean number of nucleotide substitutions per site. Beta- and Gammaproteobacterial isolates and cultivation-independent OTUs are shown in Fig. 2.

