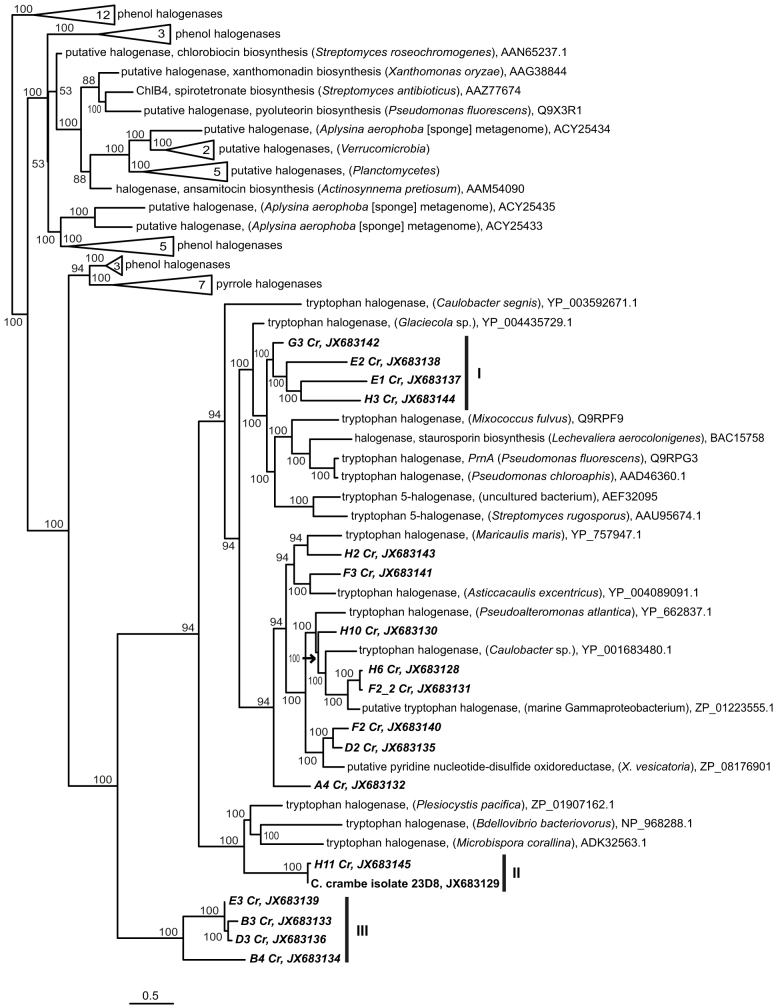
Figure 3. Phylogenetic analysis of predicted halogenase sequences.
The phylogenetic tree was constructed from 81 amino acid positions using RaxML Maximum Likelihood tree calculator. Sequences derived from this study are shown in bold. The tree has been drawn to scale and Bootstrap values greater than 50 are shown (100 replicates). Tree was rooted with the haloacetate dehalogenase from Streptomyces globisporus (AAL06675, not shown). The scale bar corresponds to the mean number of amino acid substitutions per site on the respective branch. NCBI accession numbers of reference sequences as well as those obtained in this study are indicated.

