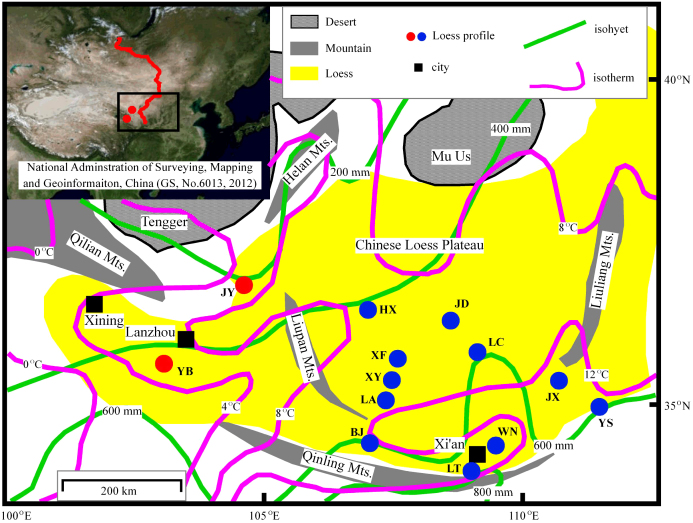
Figure 1. Locations of the Chinese loess/paleosol profiles that are cited in this paper and their basic climatic background26.
Solid red line in the top left corner shows the distribution of the surface soils for δ13CTOC study in arid central Asia28, adopted in this paper as modern quantitative relations reference27; the original image in the top left corner was downloaded from the public service website of the National Administration of Surveying, Mapping and Geoinformation, China (http://www.tianditu.cn/map/index.html). The solid red dots indicate the locations of the Yuanbao (YB) and Jingyuan (JY) profiles, and solid blue dots indicate the locations of the loess profiles in the eastern CLP for δ13CTOC studies13,14,15,16,17. For the codes and δ13CTOC records of these profiles, please refer to Supplementary Fig. S4, S5 and S6.

