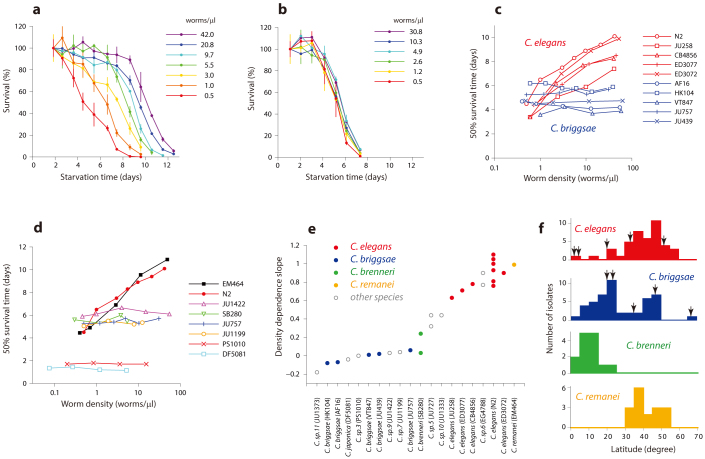
Figure 1. Some Caenorhabditis species survive L1 starvation longer when starved at high density.
(a) Survival curves of C. elegans (N2) in L1 starvation at different worm densities. (b) Survival curves of C. briggsae (JU757) in L1 starvation at different worm densities. (c) Effect of worm density during starvation on 50% survival time for various wild isolates of C. elegans and C. briggsae. Slopes of the curves reflect the magnitude of the density dependence. (d) Effect of worm density during L1 starvation on 50% survival time for several representative Caenorhabditis species. (e) Magnitude of the density effect in L1 starvation for all tested Caenorhabditis species, including various strains of C. elegans and C. briggsae. Density dependence slopes were obtained from linear regressions of 50% survival time as a function of log2(worm density). (f) Latitude distributions of four Caenorhabditis species constructed based on data from54. Arrows in C. elegans and C. briggsae distributions indicate locations where worms tested in this work (Fig. 1c) had been isolated. Note log scale for x-axes in (c) and (d).

