
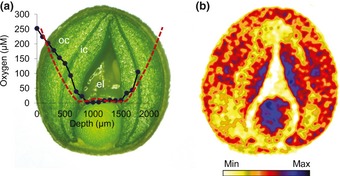
Fig 5.
Experimental measurement of oxygen distribution and respiration in the developing oilseed rape (Brassica napus) seed. (a) Oxygen concentration profile (blue line) along a horizontal transect through the seed, as determined by a needle-type microsensor. The x-axis corresponds to the penetration path of the sensor. The red dashed line indicates modelled oxygen concentrations. (b) Respiratory activity across the seed as determined by a planar oxygen sensor. The resulting respiration map is based on the fluorescence signal of the sensor, where the blue colour indicates peak respiratory activity. el, endospermal liquid; ic, inner cotyledon; oc, outer cotyledon.