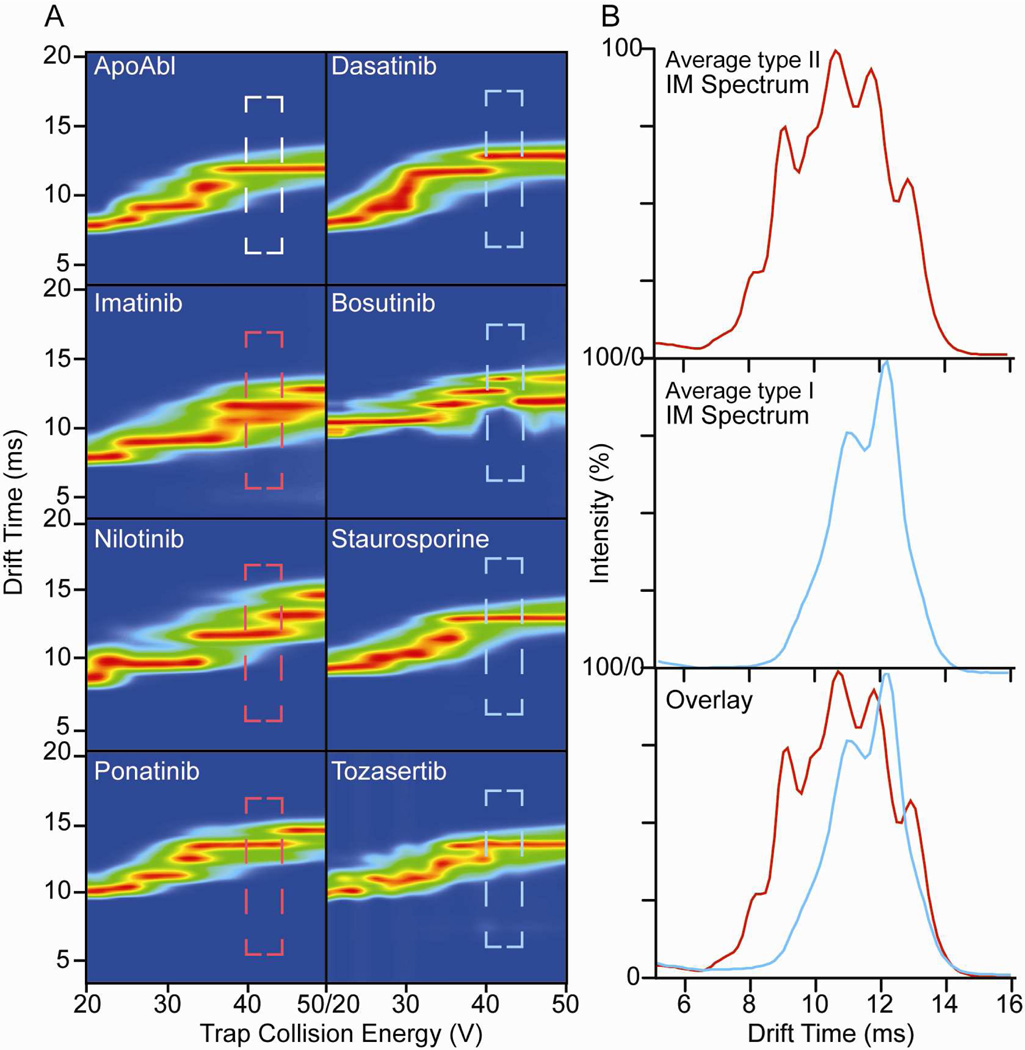
Figure 2.
CIU fingerprints for indicated 11+ Abl-inhibitor complex ions (A). Dashed areas are between 40 and 44 volts of acceleration voltage, and are color-coded to correspond with the known binding mode of the inhibitor (as previously). Average IM drift time data derived from integrating the dashed-box regions from A (B). Data from selected types (I and II as indicated) are averaged and displayed, and overlayed below. Average IM drift time data in this region provide the greatest dissimilarity between inhibitor binding types, revealing sufficient detail to classify all of the inhibitors studied in this report.

