
FIGURE 2.
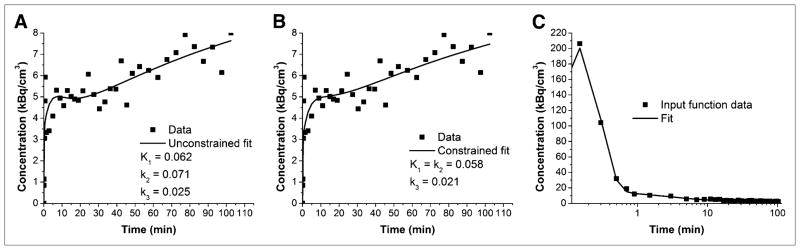
Plots of data and fitted curve from single voxel of individual rat and corresponding partial-volume–corrected input function and fit from this same animal. (A) Data and fitted curve obtained using unconstrained model. (B) Data and fitted curve obtained using constrained model. (C) Partial-volume–corrected blood data and fit plotted on log linear scale such that peak of input function can be seen.