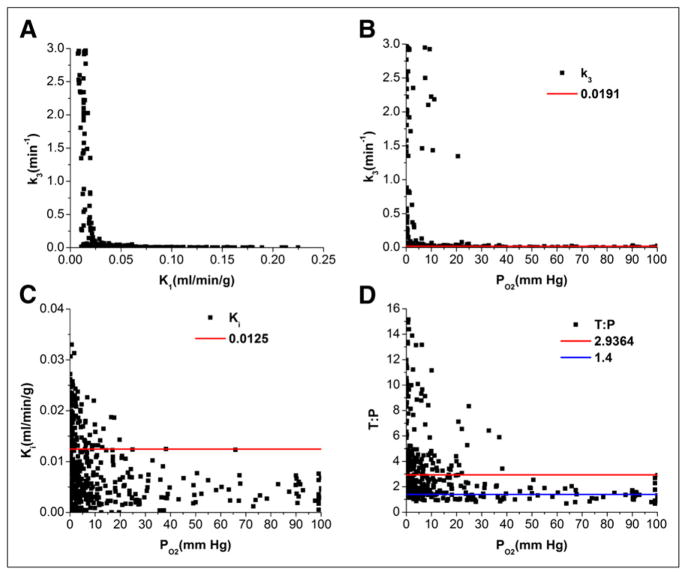
FIGURE 6.
Scatterplots of kinetic parameters estimated from constrained model (K1 = k2) vs. corresponding PO2 measure. Red lines define optimal cut points selected by Youden indices. (A) k3 vs. K1. (B) k3 vs. PO2. (C) K1 vs. PO2. (D) T:P ratio vs. PO2; blue line shows standard 1.4 threshold commonly applied in assessment of hypoxia.

