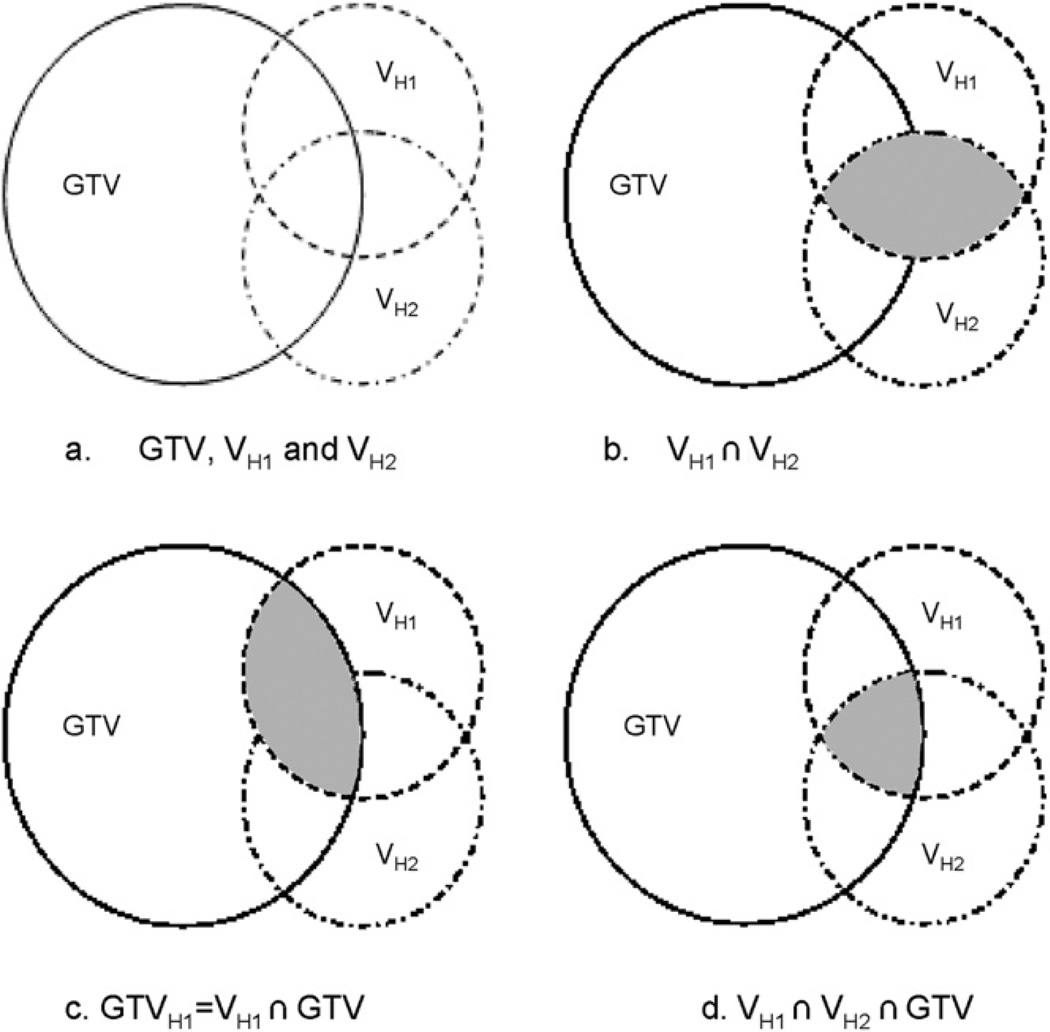
Fig. 1.
Schematics illustrating the spatial relationship between the gross tumor volume (GTV), VH1, and VH2 (hypoxia volumes from the two FMISO scans, respectively). (b) The shaded part shows the volume of intersection between VH1 and VH2. (c) The shaded part is the volume of intersection between VH1 and GTV. (d) The shaded part is the volume of intersection between VH1 and VH2 and GTV.

