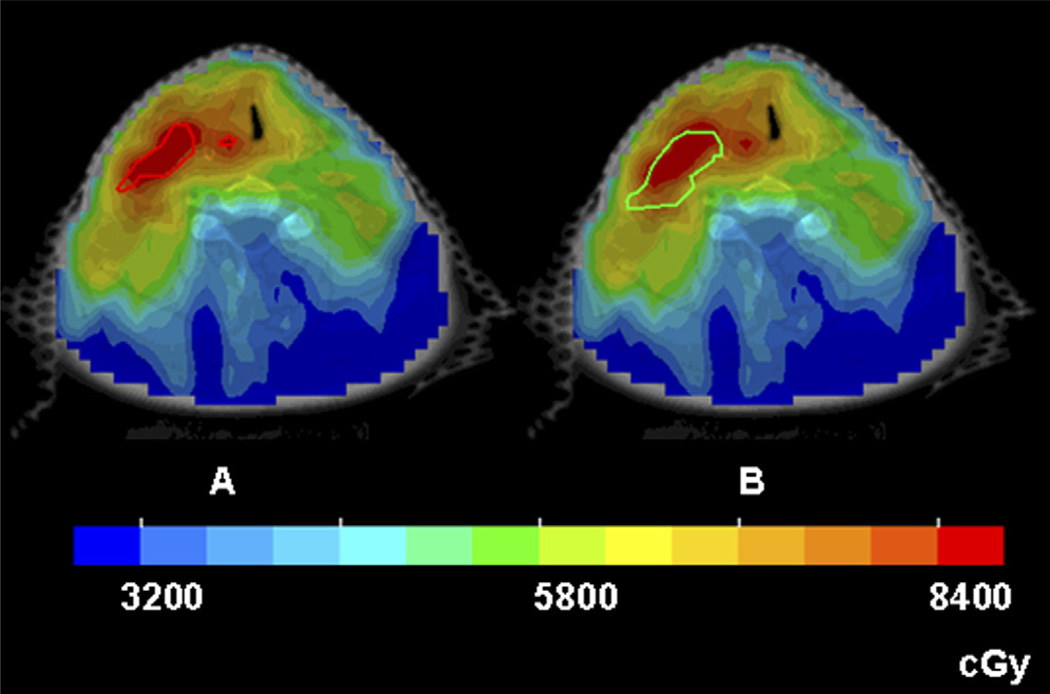
Fig. 5.
Intensity-modulated radiotherapy dose distributions in color-wash display of Patient 7, for whom the sequential hypoxia images were dissimilar. (a) Both sub-volumes of VH1 (the red contours) received 84 Gy. (b) When the same treatment plan was applied to VH2 (the green contour), part of the hypoxic volume did not receive the intended boost dose.

