Figure 7.
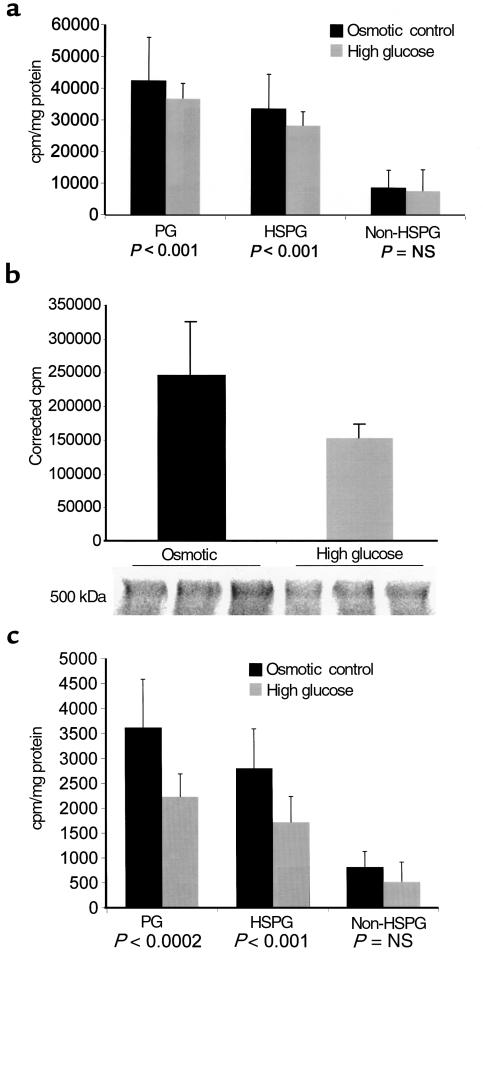
(a) [35S]SO4 incorporation (mean ± SD) into total proteoglycans, HSPG, and non-HSPG (calculated) in HepG2 cells cultured in either 25 mM D-glucose (high glucose) or 5.5 mM D-glucose, 19.9 mM mannitol (osmotic control). (b) SDS-PAGE autoradiogram of [35S]SO4-labeled HepG2 cells cultured under these conditions. The cpm per milligram of protein in the indicated diffuse proteoglycan bands (molecular weight consistent with perlecan HSPG) are shown. (c) [3H]glucosamine incorporation into isolated proteoglycan from HepG2 cells cultured under these conditions.

