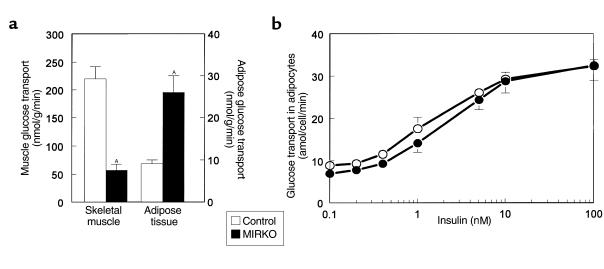
Figure 3.
In vivo and in vitro glucose transport in adipose tissue. (a) Insulin-stimulated glucose transport in gastrocnemius muscle (left) and epididymal white adipose tissue (right) in vivo in the control group and MIRKO group. (b) Basal and insulin-stimulated glucose transport in isolated adipocytes in the control group and MIRKO group. Values are means ± SE for four to nine experiments. AP < 0.005 versus control group.

