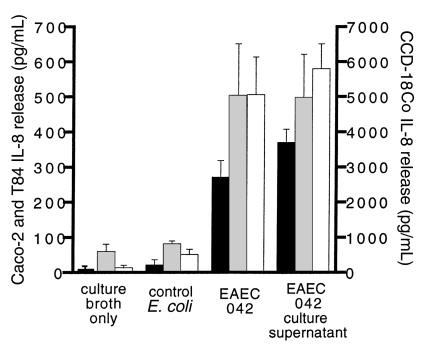
Figure 1.
IL-8 release from intestinal cell lines in response to EAEC. Five-day-old monolayers of Caco-2 (black bars), T84 (gray bars), or CCD-18Co (white bars) cells were exposed for 3 hours to live EAEC 042, filtrates of saturated overnight cultures of EAEC 042, nonpathogenic (control) E. coli (HB101, K12, or GDI 20), or culture broth alone. The separate Y-axes reflect the tenfold greater amount of IL-8 release by CCD-18Co fibroblasts compared with Caco-2 or T84 colonic carcinoma cells. Error bars represent SEM.

