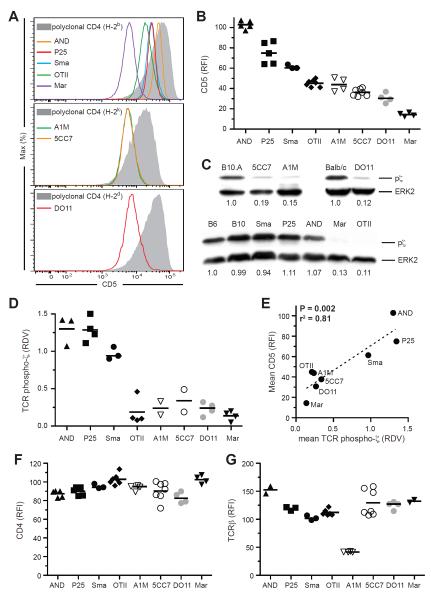
Figure 1. TCR transgenic CD4+ T cell CD5 expression reflects the clone-specific strength of self-reactivity.
(A and B) CD5 surface expression on naïve peripheral CD4+ T cells from TCR Tg mice relative to polyclonal CD4+ T cells from mice of the respective background. Representative plots, (A), data from 2–4 independent experiments, (B). (C and D) Immunoblot for tyrosine phosphorylation of the TCR ζ chain and total ERK-2 in purified peripheral CD4+ T cells. Representative blots with relative densitometry values (RDV) given below each lane (p-ζ/ERK2 ratio) relative to CD4+ polyclonal cells, (C); data from 2–4 independent experiments, (D). (E) Correlation between mean CD5 relative fluorescent intensity (RFI) and mean pζ chain RDV for each TCR Tg strain. (F and G) CD4 (F) and TCRβ (G) surface expression on naïve CD4+ T cells from TCR Tg mice relative to polyclonal CD4+ T cells from mice of the respective background.

