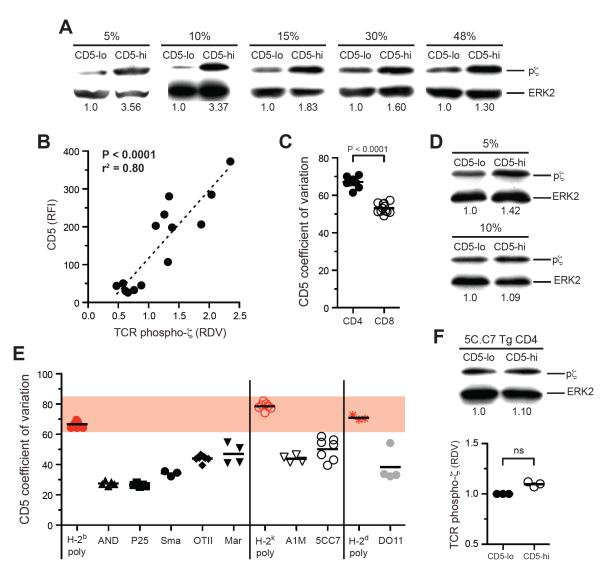
Figure 2. Polyclonal CD4+ T cells show a broad range of self-reactivity that is correlated with CD5 expression.
(A, D, and F) Immunoblot analysis for tyrosine phosphorylation of the TCR ζ chain and total ERK2 in naïve polyclonal CD5hi and CD5lo CD4+ T cells, (A); polyclonal CD8+ T cells, (D); and 5C.C7 TCR Tg CD4+ T cells, (F). RDV relative to the CD5lo population is given below each lane. Sort stringencies are for the 10% highest or lowest populations unless specified otherwise. Representative data from 2–3 experiments are shown. (B) Correlation between CD5 RFI and phospho-ζ RDV for CD4+ T cells sorted on CD5 expression. RDVs are normalized relative to unsorted CD4+ polyclonal cells. Data are from 5 independent experiments. (C and D) CD5 coefficient of variation for polyclonal CD4+ and CD8+ T cells, (C); polyclonal or TCR Tg CD4+ T cells (E). ns, not significant.

