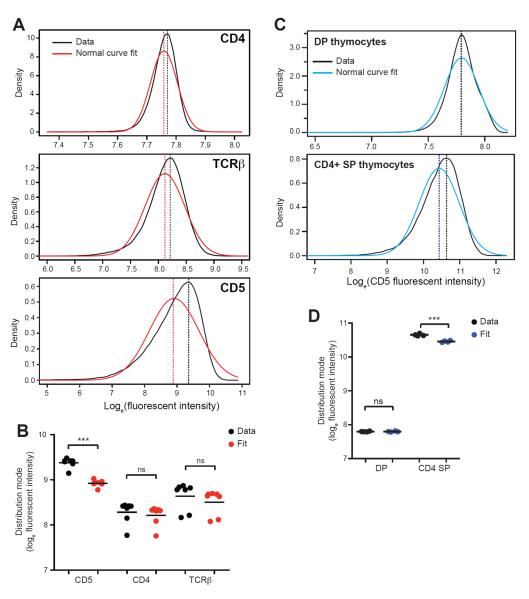
Figure 6. Thymic selection skews the naïve CD4+ T cell repertoire towards cells with greater self-sensitivity.
(A – D) A normal distribution was fit to the natural log-transformed distribution of CD4, TCRβ, or CD5 fluorescent intensity measured in individual mice. The mode of the best normal fit and of the experimental data were compared to assess for a skew in the distribution of the fluorescent intensity data. (A and C) Representative data with the best normal fit are shown for peripheral CD4+ T cells, (A) and double positive, CD3lo CD4+CD8+ (DP) or single positive (SP) thymocytes, (C). Dashed lines indicate distribution mode. (B and D) Mode of fluorescent intensity data or best normal fit to the data is shown for peripheral CD4+ T cells, (B) and DP or SP thymocytes, (D). Circles represent modes from data or fit of individual animals, lines denote means. **P<0.01, ***P<0.001; ns = not significant.

