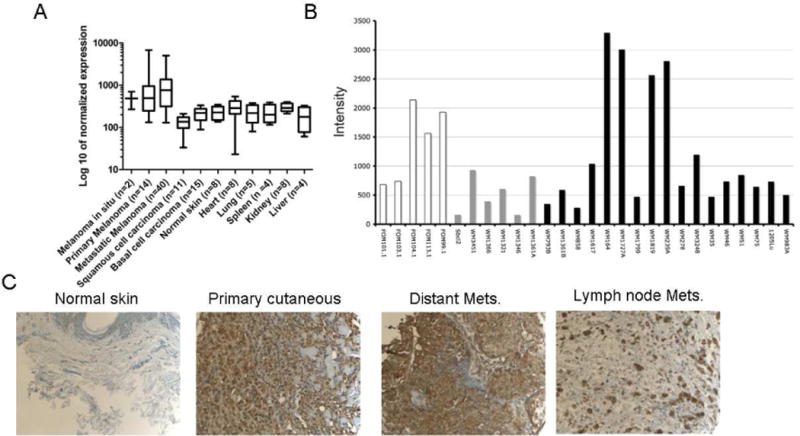
Figure 1.

A) DNA microarray expression profile of MC1R in melanoma, other skin cancers and normal tissues. Data are represented as mean ± SD. Note the log10 scale. B) DNA microarray of primary human melanocytes (white), melanoma cell lines with the NRAS mutation (gray) and melanoma cell lines with the BRAF mutation (black). C) Representative IHC staining of MC1R in normal skin with a pathology score of 3 and different types of melanoma with pathology score of ≥4.
